



Kano mhGAP training follow-up offers a useful lesson for anyone evaluating a short professional course: the outcome and the follow-up date matter. A new trial reports knowledge and clinical-vignette scores three months after training. Those measures can inform an evaluation plan, but they do not show what happened to patients.
Danjumma and colleagues’ study, published 20 November 2026, is a peer-reviewed accepted early version in the International Journal of Mental Health Systems. The publisher says editing may continue before the final version. We checked that status and the full manuscript before transcribing the results. The publication date is not the training date: the manuscript places intervention training in February 2025.
What the Kano mhGAP training follow-up randomised
The researchers randomly allocated 180 primary-care workers to two arms of 90. One received four days of structured, face-to-face mhGAP-based training. The wait-list comparison arm received general health education during the study, then the mental-health training after the assessments. This was a local workforce trial, not a national rollout or a survey of all Nigerian facilities.
Follow-up numbers also matter. The manuscript reports one intervention participant opting out after allocation, leaving 179 for the immediate assessment. Three further people could not be reached at follow-up, leaving 176. Therefore,90 per arm describes randomisation; it should not silently become the denominator for every later assessment.
The two outcomes used different instruments. The Mental Health Knowledge Questionnaire measured factual knowledge on a 0–20 scale. Clinical case vignettes assessed decisions on a 0–12 scale. A response to a paper case is useful educational evidence, but it is different from observing the same worker in routine practice.
Kano mhGAP training follow-up: knowledge on its own scale
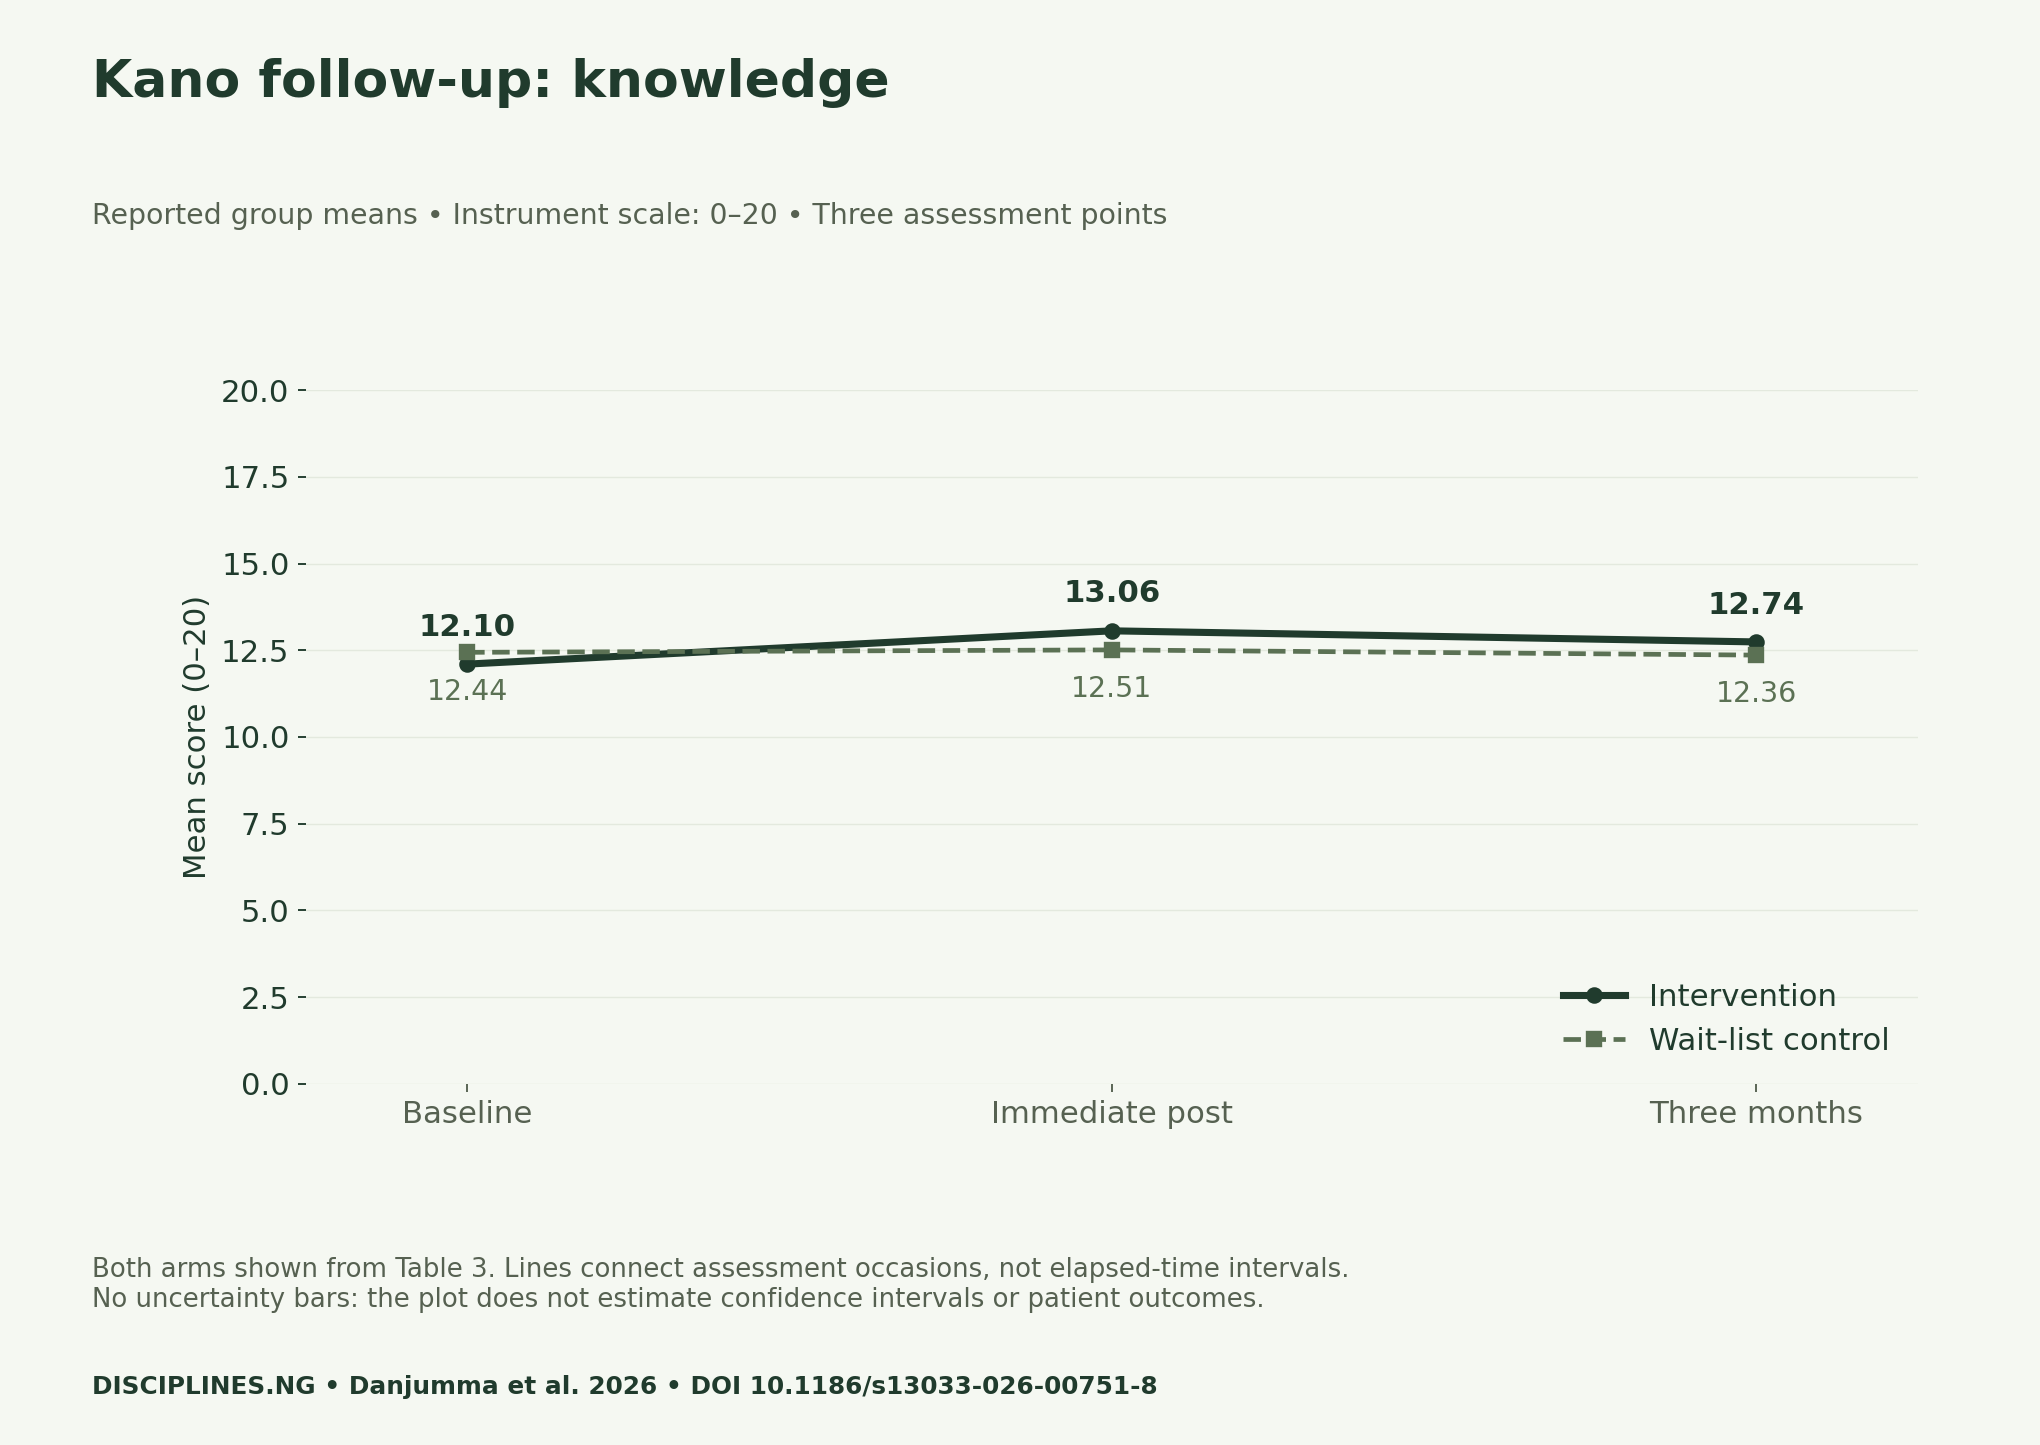
The intervention mean rose from 12.10 before training to 13.06 immediately afterwards, then measured 12.74 at three months. Our simple follow-up subtraction is 12.74−12.10=0.64 points. Dividing by the instrument maximum gives 0.64/20×100=3.2 percentage points of that maximum. That is an arithmetic description of the reported group means.
It is not a patient improvement rate or an adjusted intervention effect. The unadjusted three-month between-arm knowledge comparison was not statistically significant in the manuscript. The baseline-adjusted analysis, however, reported a significant result, with partial η²=0.056 and p=0.002. These analyses answer different questions; do not substitute the simple subtraction for the adjusted model.
Read vignette decisions on the 0–12 scale
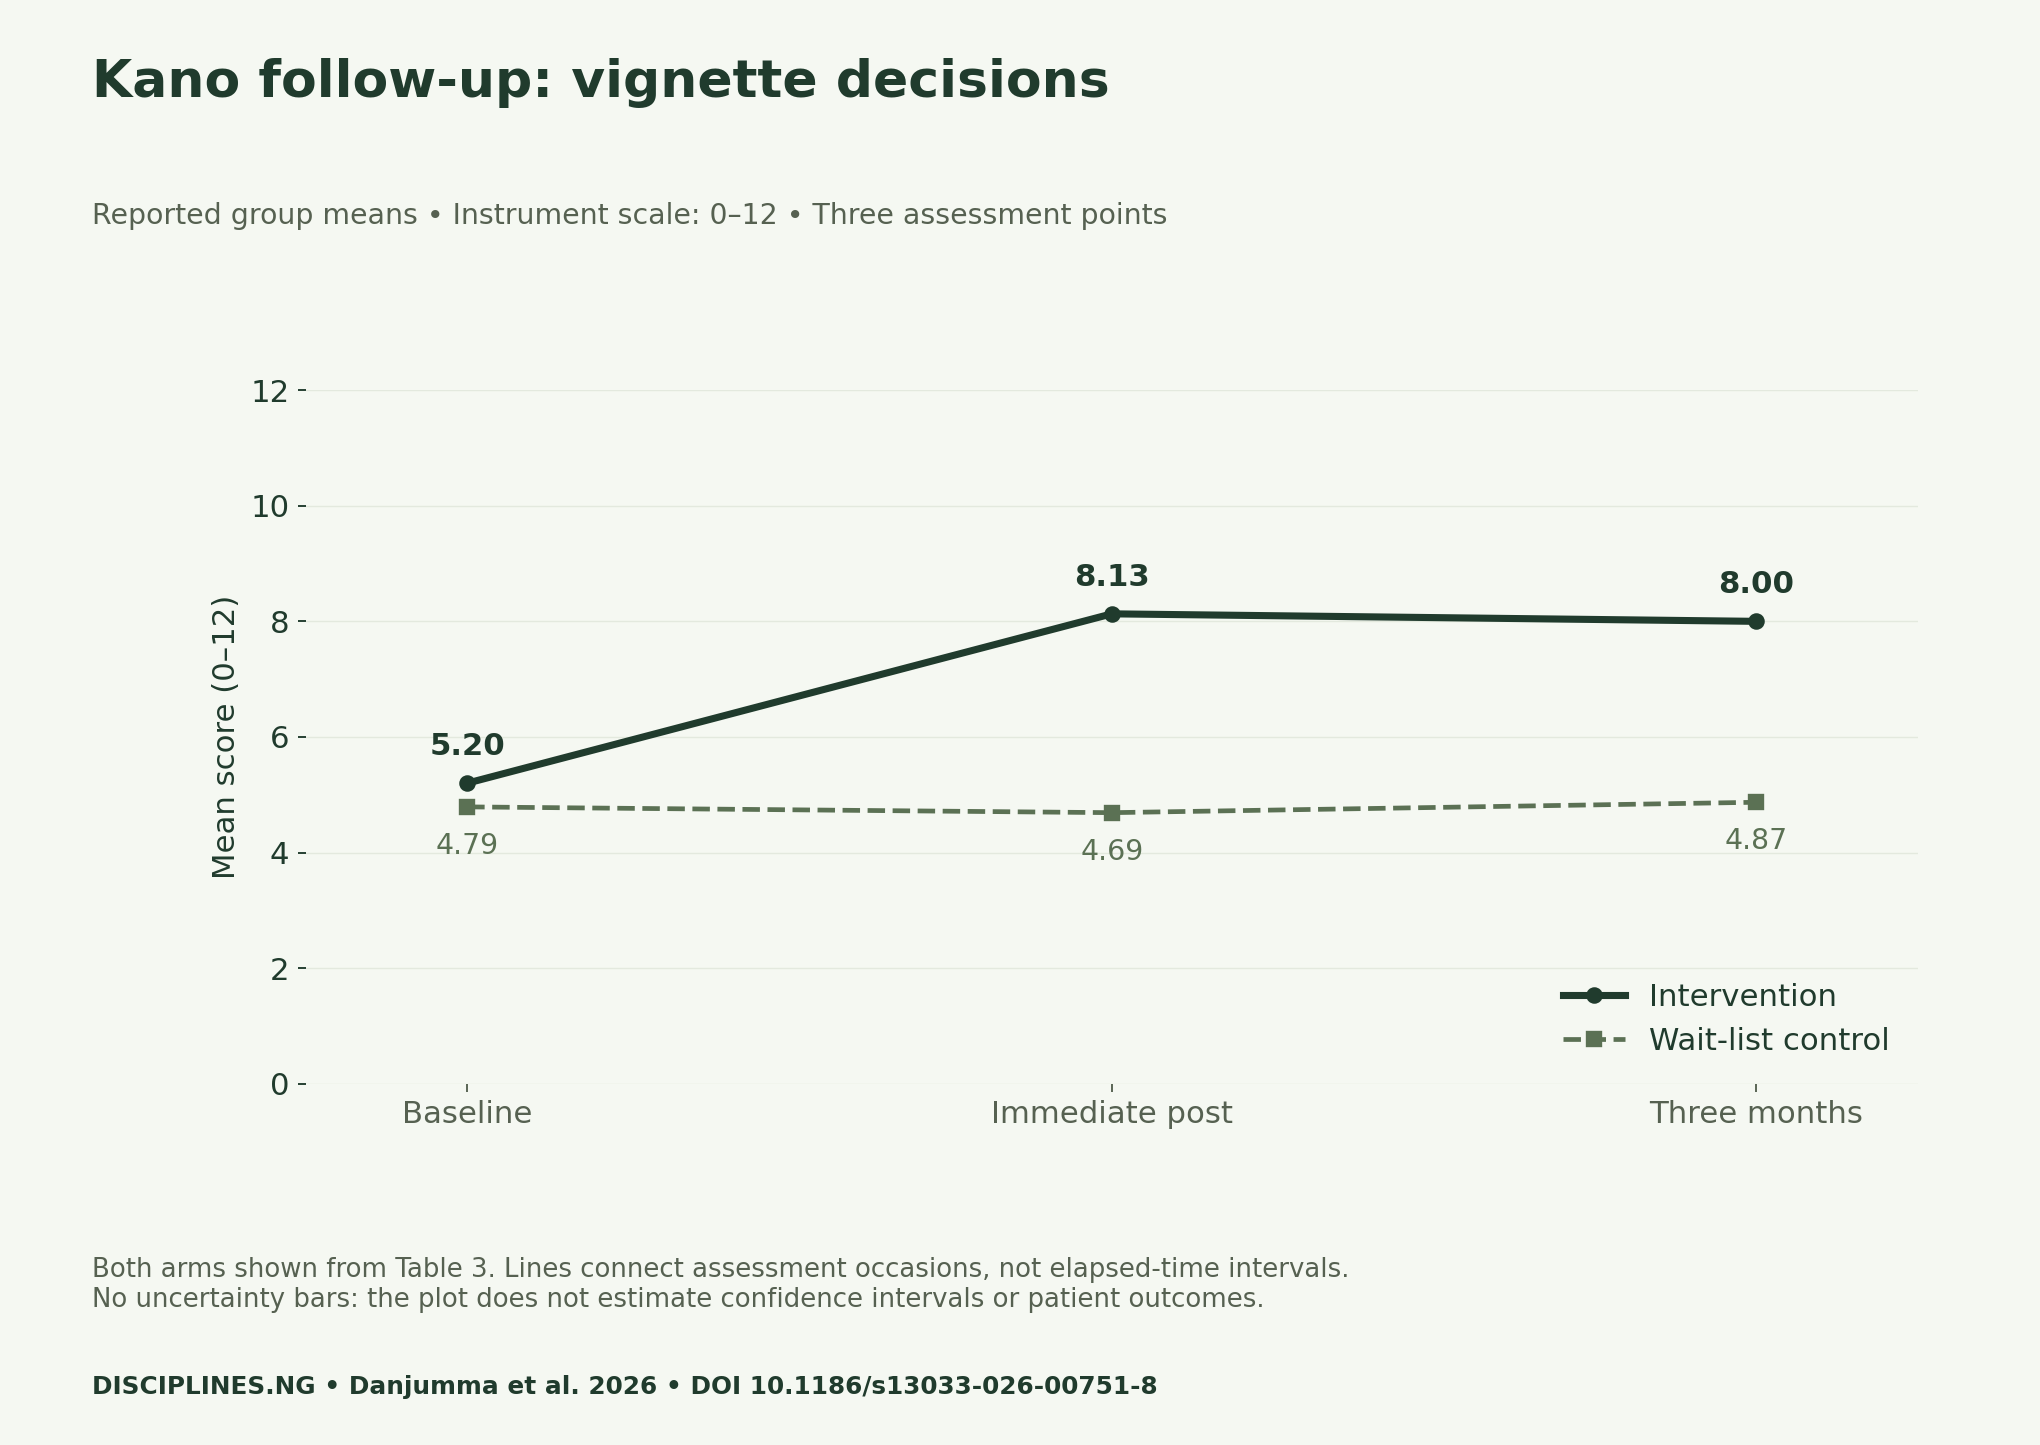
The intervention vignette mean moved from 5.20 to 8.13, then 8.00. The three-month change from baseline is 2.80 points, equivalent to 23.3 percentage points of the 12 point scale maximum after rounding. The study separately reports three-month baseline-adjusted partial η²=0.437. This is an effect-size statistic from its model, not the percentage of patients helped.
Do not divide 23.3 by 3.2 to claim one outcome was several times more effective. The instruments have different content, score ranges and measurement properties. Even putting both on a percentage-of-maximum scale does not make them interchangeable. Keep the raw points, denominator and outcome label together in any slide or report.
What lasted, and what remains unmeasured
At three months, the reported intervention means remained above baseline on both instruments. The manuscript did not find a statistically significant decline from immediate post-training to follow-up. That does not prove that no individual declined, that the scores are identical or that learning persists indefinitely. It describes the study’s tests within its observation period.
The authors identify limitations including short follow-up, vignette-based assessment, inability to blind participants and facilitators, and possible contamination between groups. Routine care also depends on resources, supervision and referral arrangements. Those are reasons to collect appropriate implementation evidence, not permission to infer patient outcomes from a classroom score.
Build the next evaluation around three evidence levels
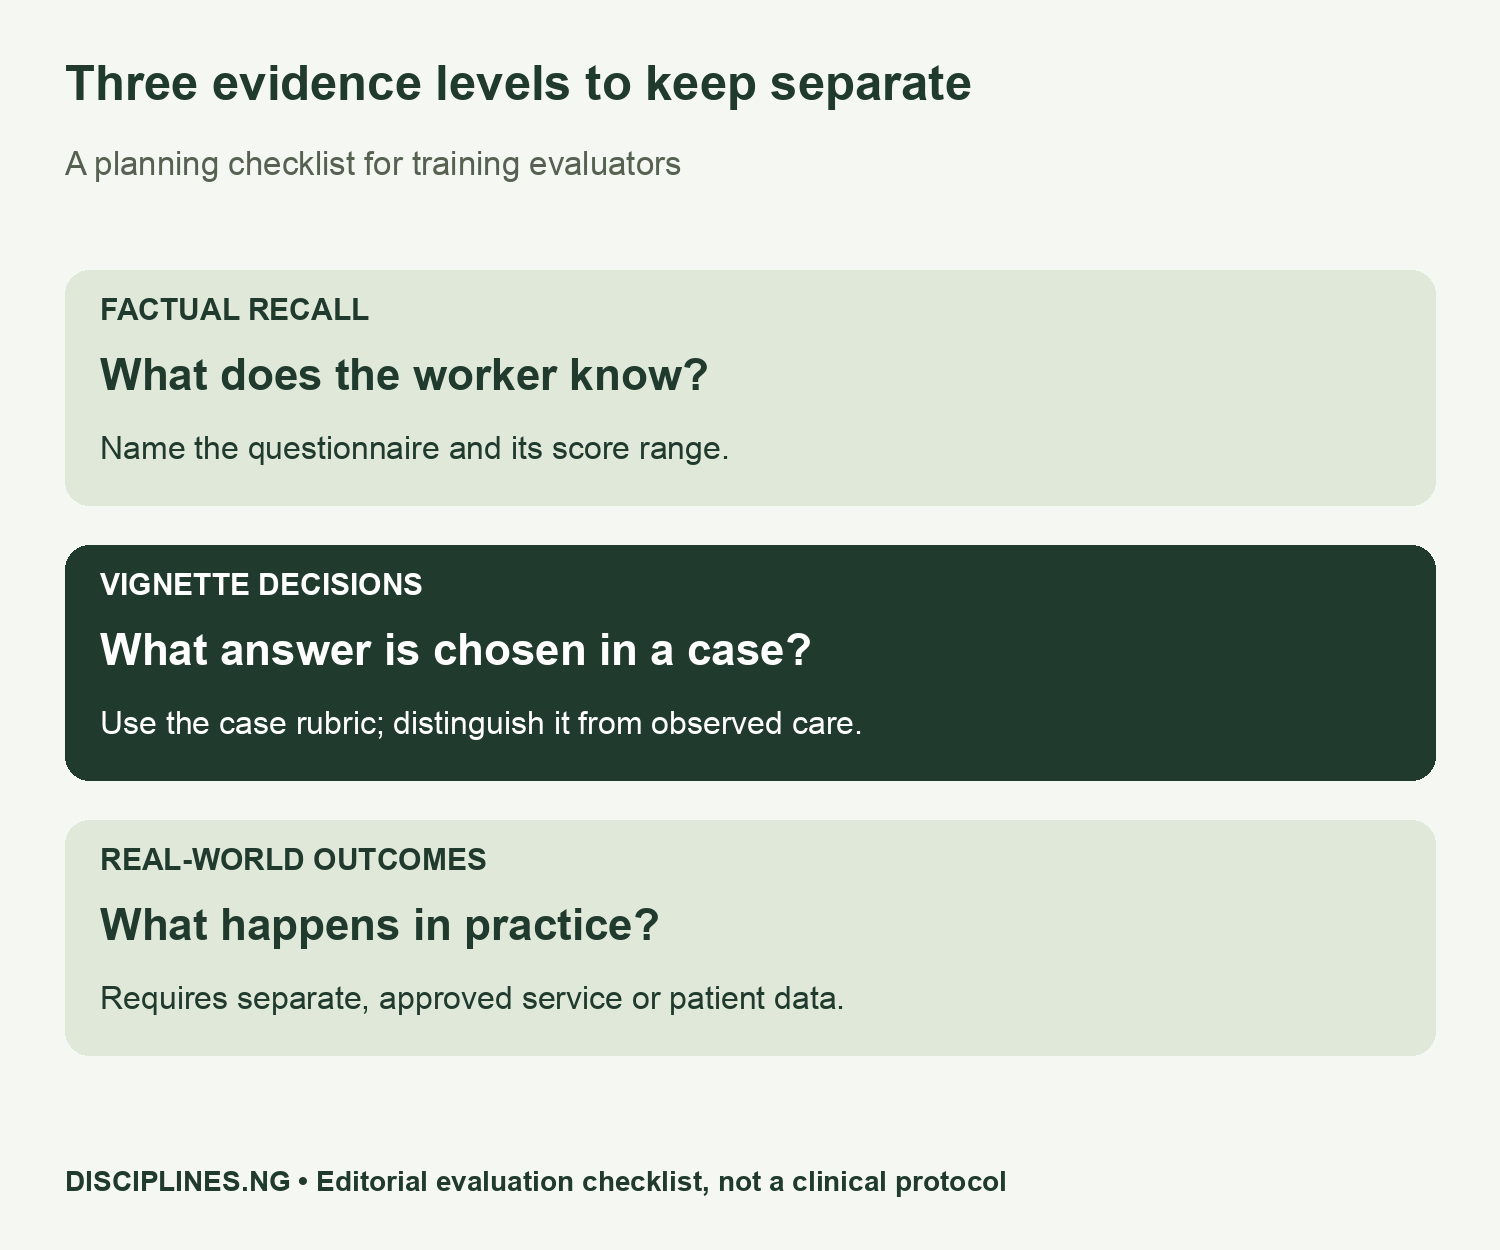
First, name the learning question and retain the instrument’s actual scale. Record when the baseline and follow-up occur, which workers are eligible and how missing observations will be handled. A completion certificate alone cannot answer how a score changed. Equally, a changing score cannot answer whether a different cohort received the same training.
Next, specify the comparison. A before-and-after difference within one arm can reflect more than the training alone. If your design includes a comparison group, preserve its definition and analysis plan. Seek appropriate methodological and ethics review before collecting new data. Do not retrofit a causal claim to an uncontrolled attendance or satisfaction spreadsheet.
Finally, decide whether your question concerns real-world practice. If it does, define a separate, approved source and a suitable outcome. Our blank worksheet asks for a privacy and approval plan, not patient names or health records. It helps a teaching team frame a proposal; it does not authorise data collection or evaluate a clinician’s fitness to practise.
Reproduce the calculations and use the four downloads
We transcribed group means from Table 3 and the adjusted effect-size statistics from Table 4 of the accepted manuscript. The arithmetic uses the intervention’s reported baseline and three-month means. We round only the final percentage-of-maximum results to one decimal. These descriptive changes are not a reanalysis of participant-level data, which we did not obtain.
The two plots use their full instrument ranges and the same three named assessment occasions. Control means are included only because we verified them in the manuscript. We do not derive confidence intervals from standard deviations or assign a clinical meaning to a score threshold. Consult the source’s final version if it replaces the early manuscript.
For related context, see our health-service costing analysis, which concerns budgets rather than training outcomes, and browse Health Sciences. The Research & Reports archive keeps source-linked methods and reusable tools together.
- Reported means with arms and scale maxima (CSV)
- Reproducible follow-up calculations (CSV)
- Blank evaluation planning worksheet (CSV)
- Measure and source dictionary (CSV)
Source credit: Danjumma MM and colleagues, 2026, DOI 10.1186/s13033-026-00751-8, licensed CC BY 4.0. Figures are redrawn and calculations added by Disciplines In Nigeria. Suggested citation: “Kano mhGAP Training Follow-Up: What Lasted Three Months?”, 21 November 2026.


