





Health service costing scenarios Nigeria research can teach an important distinction: a target and its modelled cost need not move in the same proportion. In a Kaduna example, raising target coverage from 25% to 50% increases the displayed annual-average requirement from ₦20.65bn to ₦26.58bn. That is ₦5.93bn, or 28.7%, more—not a doubled cost.
The example comes from Fasawe and colleagues’ accepted paper, published on 12 November 2026. It models sexual and reproductive health and rights services in Kano and Kaduna for 2023–2028. Its outputs are estimates under assumptions, not current patient bills or audited government spending. The manuscript also contains a scenario-value discrepancy worth retaining.
Health service costing scenarios Nigeria: start with the measure
A scenario is a conditional calculation. First identify the services included, coverage definition, geography, projection horizon and unit. Then establish whether a reported cost is annual, cumulative or a period average. Mixing those measures can create a much larger error than rounding a decimal.
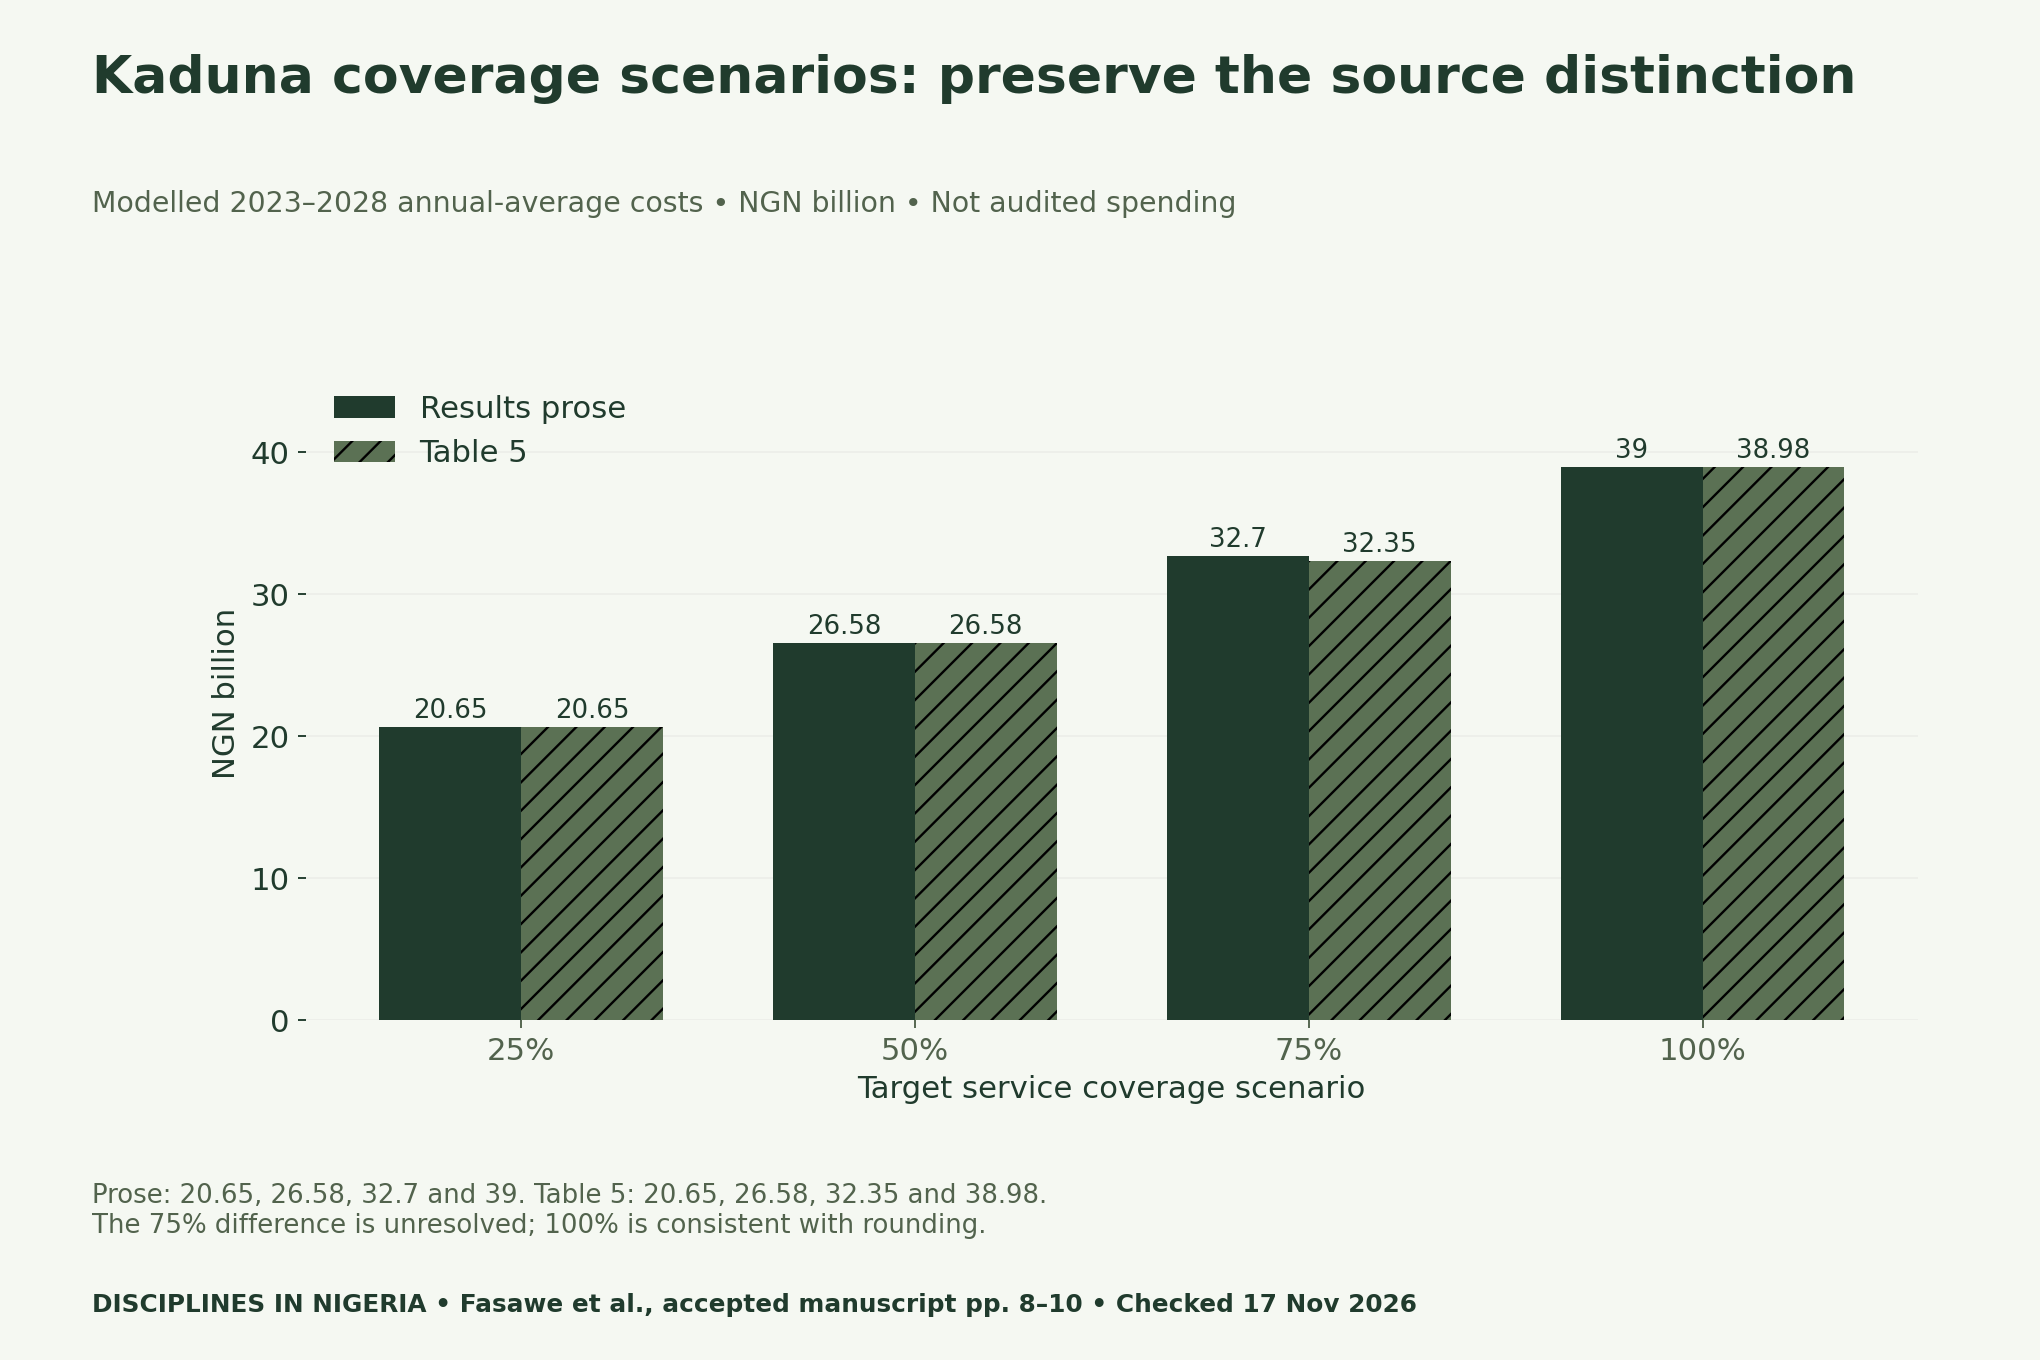
Here the results prose describes annual averages over the projection period. Table 5 labels its columns as total costs. The chart keeps the source locations explicit. A student should carry those labels into a literature-review ledger and seek clarification before using the values in an operational budget.
For Kaduna at 75% coverage, the prose reports ₦32.7bn while Table 5 reports ₦32.35bn. This is not ordinary one-decimal rounding of the table value. At 100%, ₦39bn in prose is compatible with rounding ₦38.98bn. No author clarification or corrected value has been obtained.
Reproduce the comparison that agrees across the source
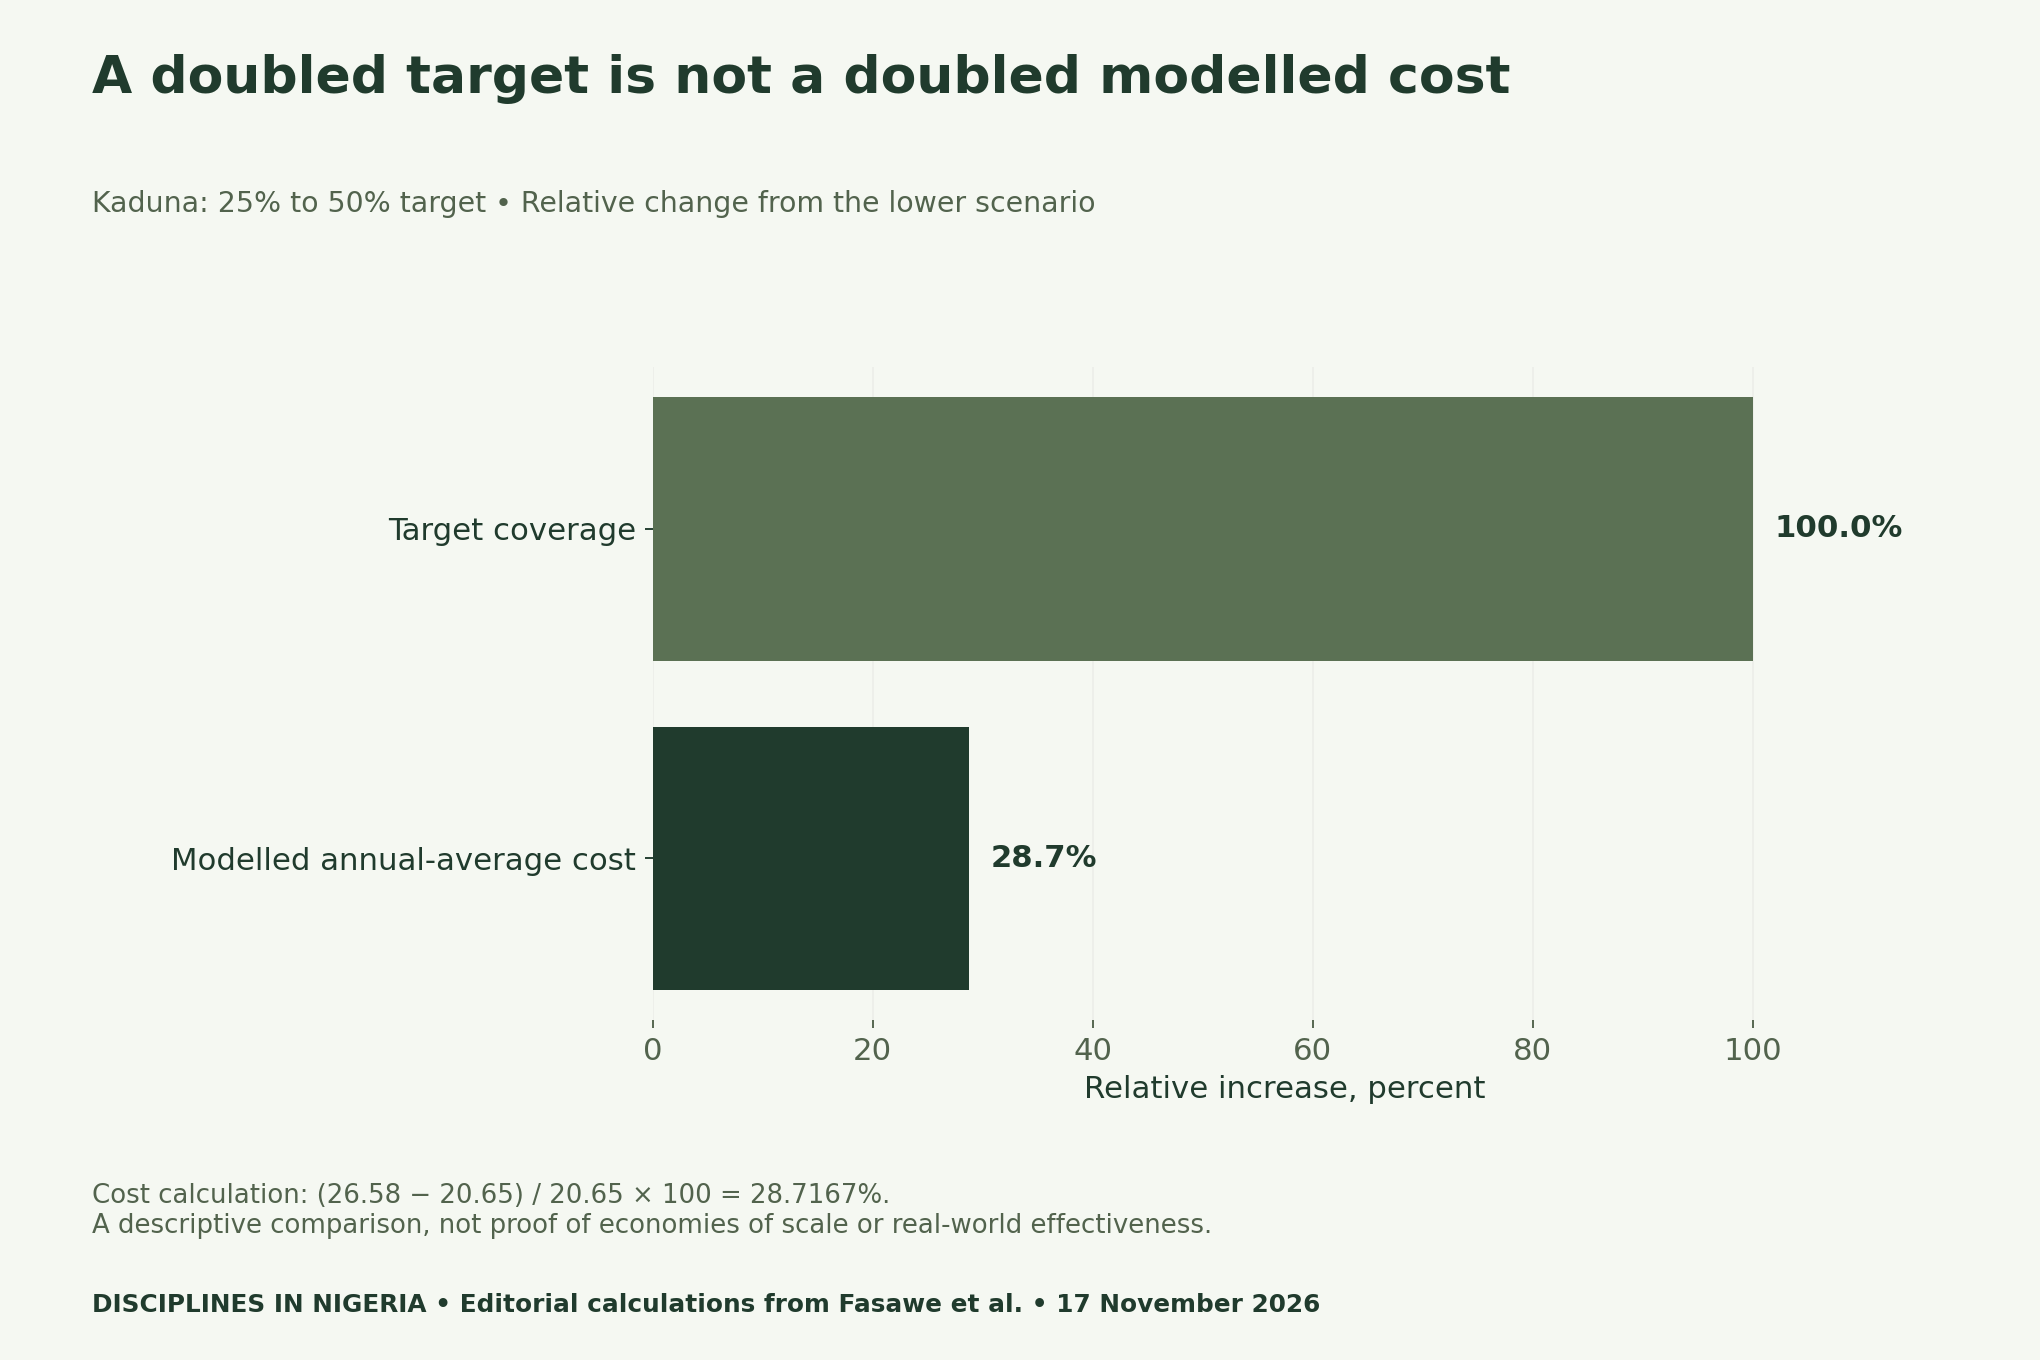
The subtraction is 26.58 minus 20.65, giving ₦5.93bn. Divide that difference by the lower scenario’s ₦20.65bn and multiply by 100. The result is approximately 28.7167%. Retain the unrounded calculation in the CSV and round consistently in the narrative.
Coverage rises by 25 percentage points, from 25% to 50%. Relative to 25%, that is a 100% increase. Percentage points and percent change answer different questions. Label both explicitly so that a reader does not mistake a target change for observed service delivery.
This arithmetic alone cannot prove economies of scale. A package can contain different service volumes, fixed and variable inputs, baseline coverage and shared resources. The model structure must explain the relationship. It is also possible for an apparently attractive cost comparison to coexist with capacity or delivery constraints.
Keep the input trail visible
The paper describes mixed costing, using programme inputs and broader cost assumptions. Its baseline sources include NDHS 2018 and MICS 2021; some commodity-price documents refer to 2023. Publication in 2026 does not make every input a 2026 observation. The study itself acknowledges the need for updated assumptions.
The blank provenance sheet asks for each input’s value, unit, period, source and assumption status. Record defaults as defaults. A treatment protocol, staffing ratio or infrastructure allocation should not become an observed local fact simply because it appears in a spreadsheet. Make the distinction visible to anyone reusing the model.
Before comparing another study, check that the service bundle and population are compatible. A wider package may have a higher total without being less efficient. Likewise, dividing by a different population changes a per-person figure. Reconcile numerator and denominator before ranking results.
Separate a target, requirement, allocation and spending
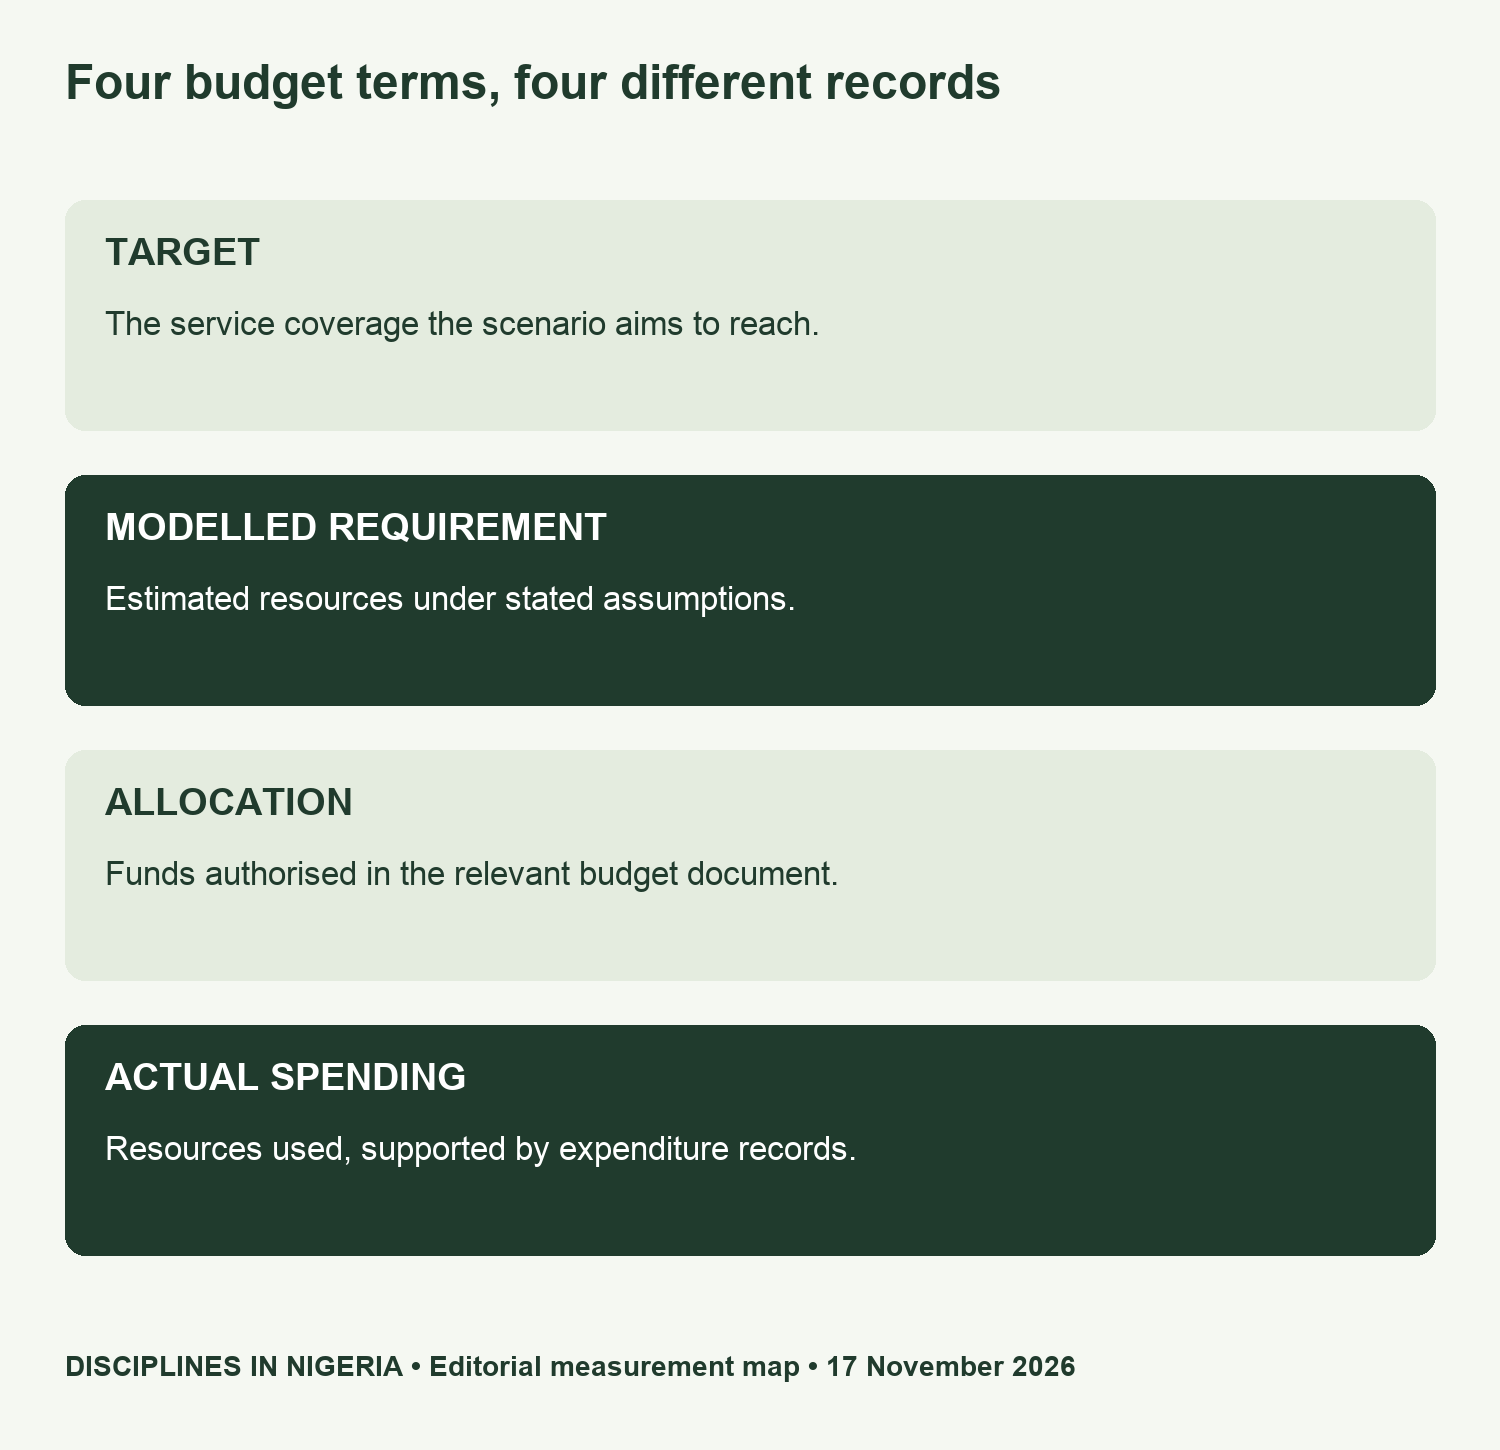
A modelled requirement can inform a planning question. An allocation records an authorised budget decision. Actual spending requires expenditure evidence. These records may concern different periods and scopes. Put them in separate ledger fields before calculating a gap, and document which funding measure is available.
Do not call a projected requirement a commitment or present it as the price a patient will pay. The article examines model interpretation for students and researchers. It does not advise a household on treatment, establish a benefit entitlement or recommend an operational allocation.
Use sensitivity analysis to test an assumption
The accompanying sensitivity worksheet uses a fictional total of ₦100bn and a fictional ₦20bn component. Changing only that component by minus or plus 25% changes the total to ₦95bn or ₦105bn. These are teaching calculations, separate from the paper’s own sensitivity results.
One-way sensitivity keeps the other inputs fixed. It is useful for understanding a formula, but it is not a confidence interval or a forecast of all possible outcomes. Record which input changed and why the chosen range is appropriate before applying the method to a real analysis.
For related methods, see our Health Sciences archive. A useful dissertation contribution may be a transparent assumption audit, even when the underlying model cannot be rerun. State exactly which checks were possible and which remain unresolved.
Method, limitations and four CSV tools
We inspected the accepted manuscript, including the results on page 8 and Table 5 on page 10, on 17 November 2026. We independently calculated the lower-scenario comparison and retained the source discrepancy. The new charts are editorial statistical graphics, not copies of the paper’s figures.
We did not rerun the OneHealth model, validate current service costs or reconcile the differing 75% values with the authors. Updated inputs and appropriate disciplinary review are needed for operational use. The worksheets are teaching aids, and the model outputs should not be presented as verified current spending.
- Scenario values with prose and table provenance (CSV)
- Reproducible coverage and cost comparison (CSV)
- Blank model-input provenance sheet (CSV)
- Fictional one-way sensitivity worksheet (CSV)
Suggested citation: Disciplines In Nigeria, “Nigerian Health-Service Costing: Why Twice the Coverage Need Not Mean Twice the Budget”, 17 November 2026. Primary research: Fasawe et al., DOI 10.1186/s12913-026-16120-7; calculations and teaching tools by this publication.


