






Fertilizer price analysis in Nigeria needs exchange rates, product units and market stages on the same footing. A lower world dollar benchmark does not automatically mean a lower naira cost. Likewise, a gap between a retail quote and a world price is not automatically a trader’s profit.
This research guide separates historical observations from a fictional conversion example. Three charts, a comparison infographic and four free CSV tools help agricultural-economics students build a transparent argument. The figures are not current fertilizer quotations, a forecast or evidence of anti-competitive conduct.
Fertilizer price analysis in Nigeria: exchange rates and timing
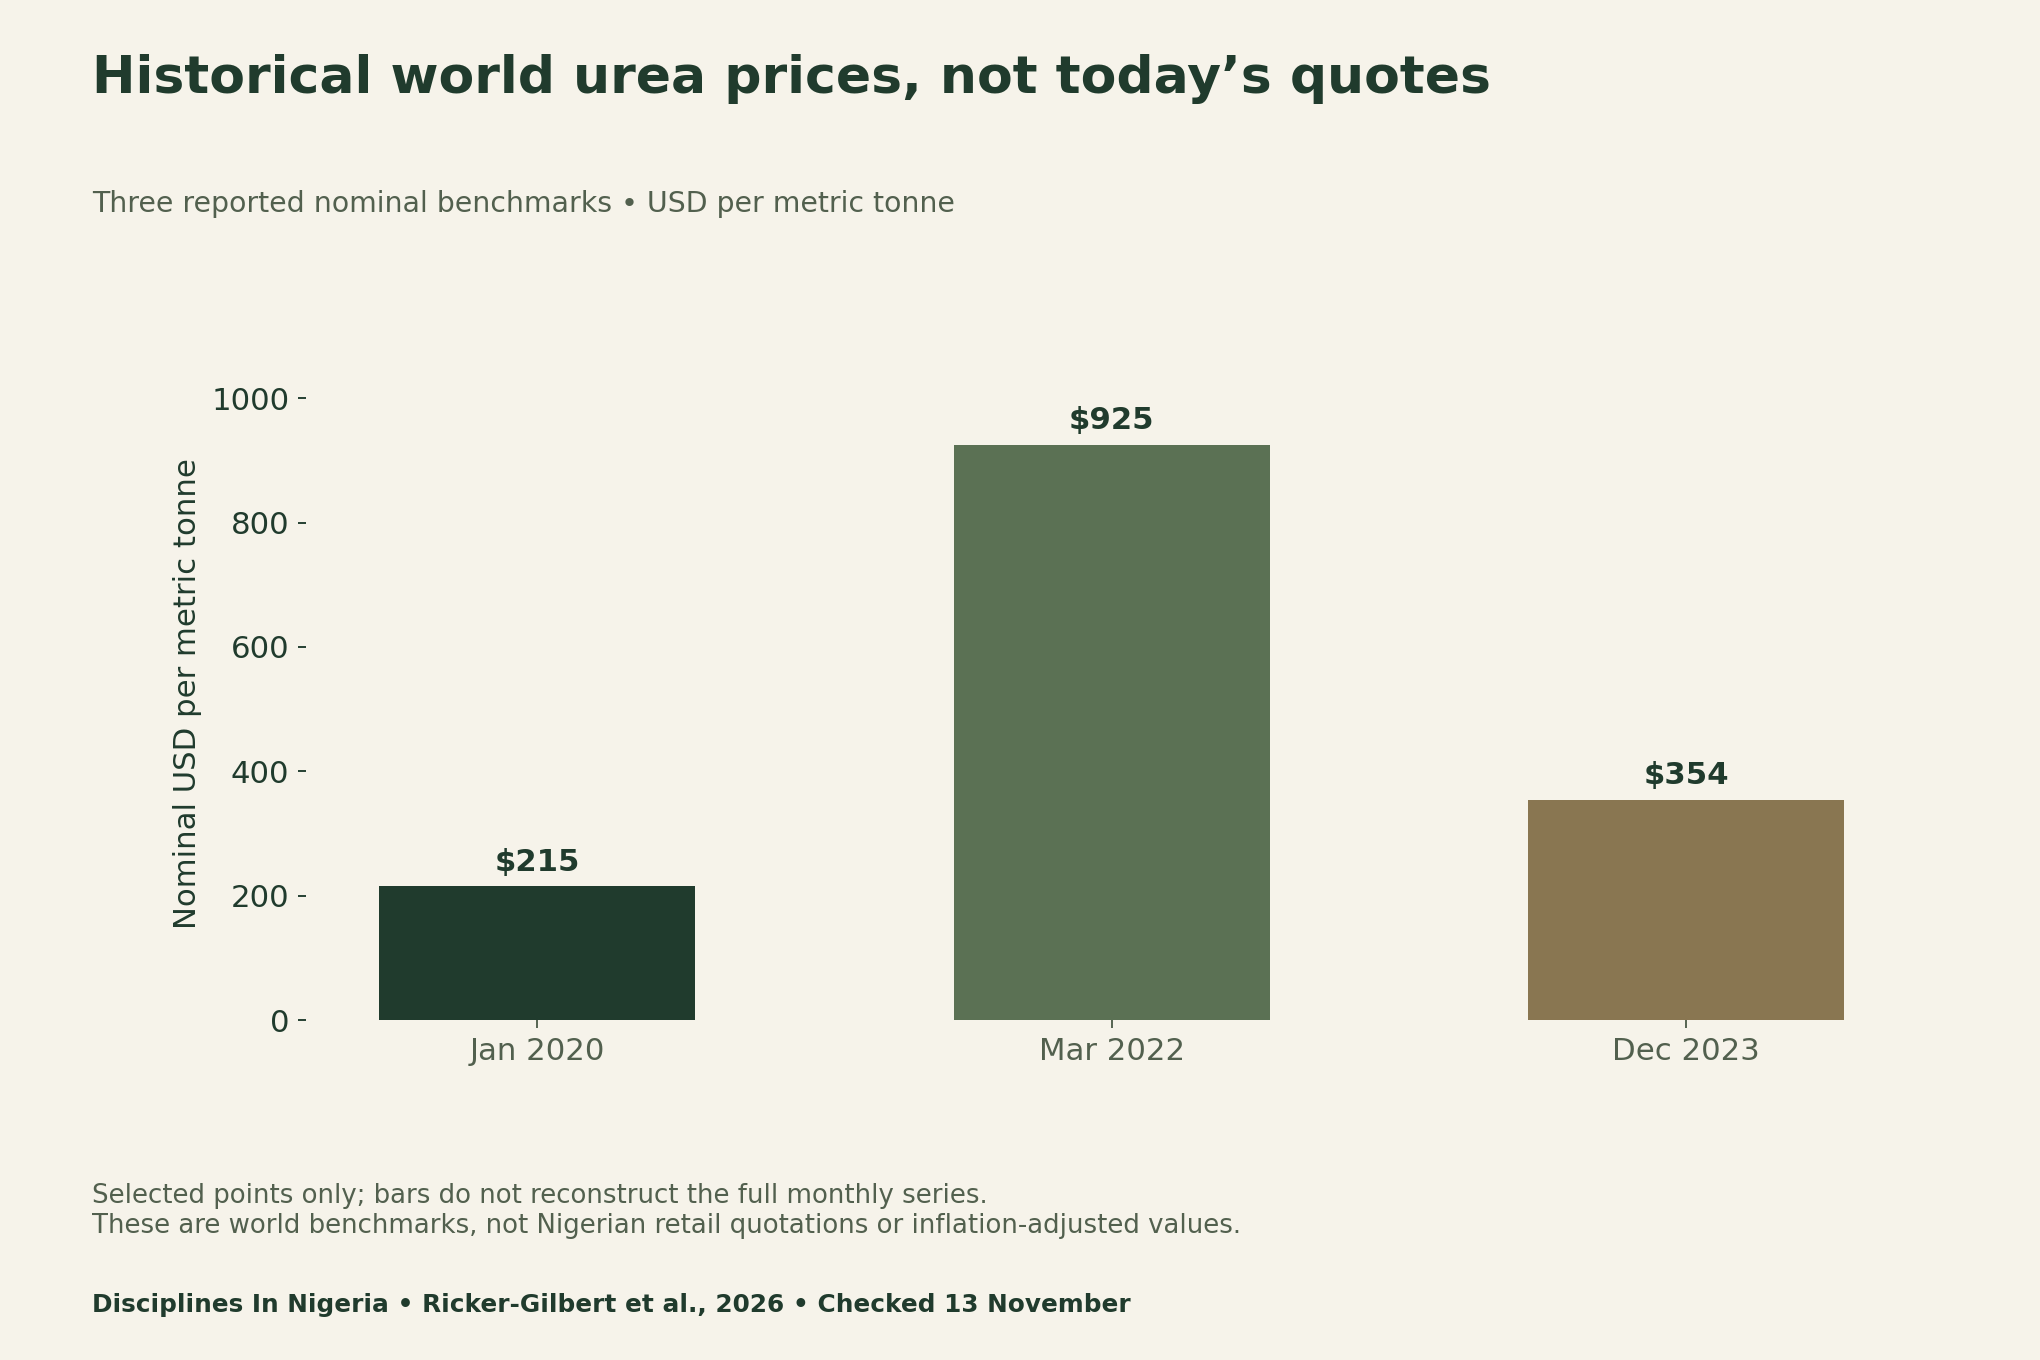
The Agriculture & Food Security study by Ricker-Gilbert and colleagues, published 12 November 2026, covers six countries including Nigeria. Its price analysis uses monthly urea data for 2010–2023. The selected world benchmarks below are historical nominal values, not November 2026 Nigerian prices.
Match the product, mass and market stage
Begin with the original observation. Record the fertilizer specification, bag mass or tonne unit, location, date and delivery basis. A quote for one blend cannot silently become a urea price. Similarly, a price per bag needs the actual bag mass before conversion to a tonne.
Next, identify the market stage. An international benchmark and a delivered retail quote can include different services and costs. Preserve those differences in the data dictionary rather than treating the two numbers as interchangeable observations of the same transaction.
Use a fictional example to isolate the currency arithmetic
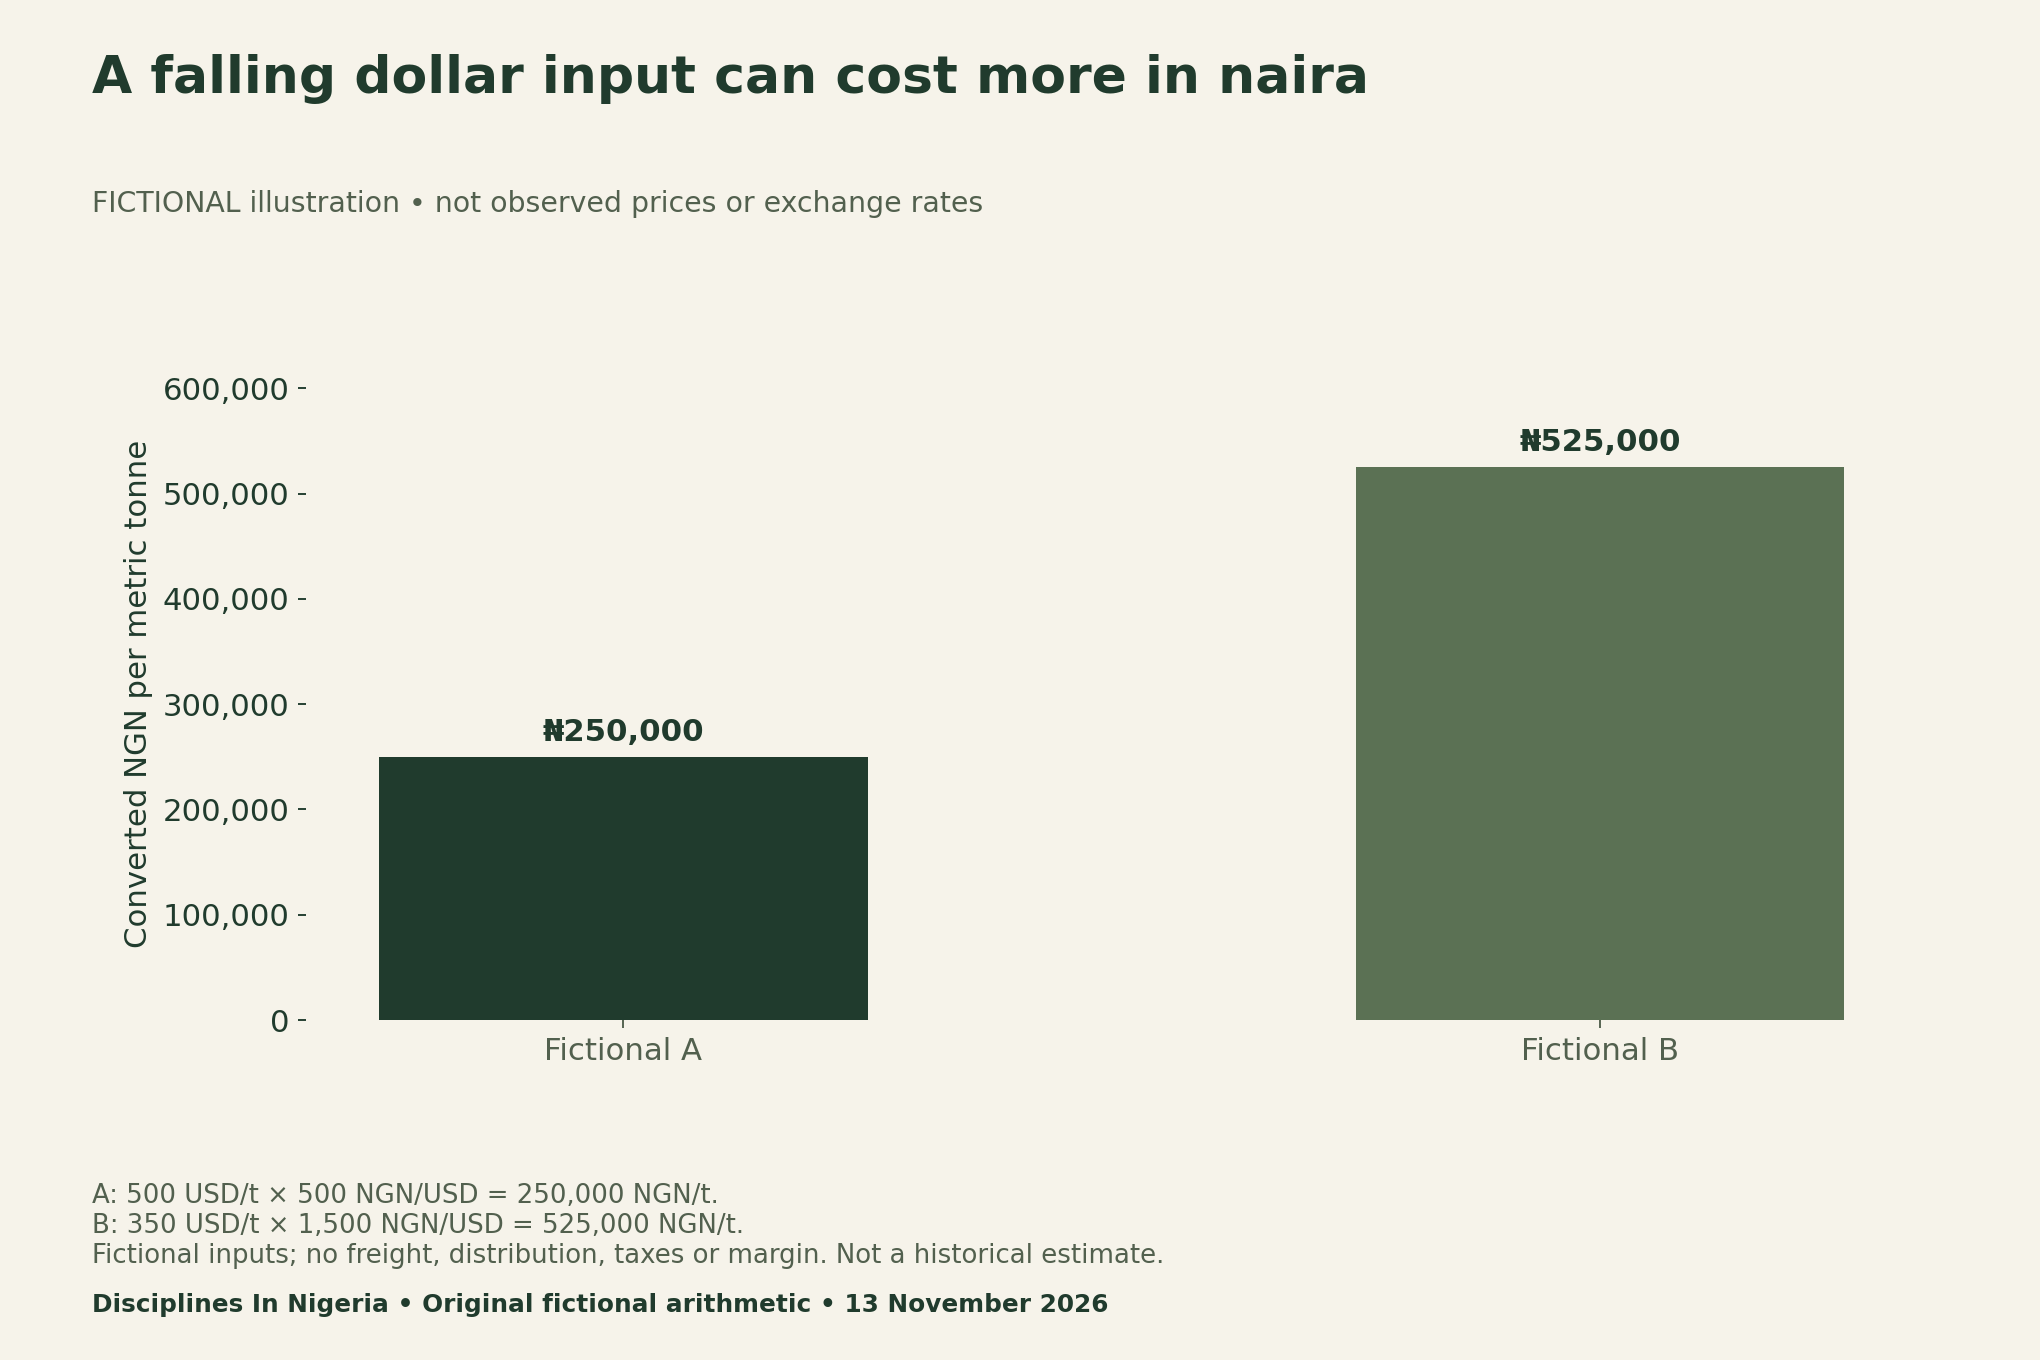
In this example, the dollar input falls by 30% while the exchange-rate input triples. The converted naira amount rises by 110%. That result follows from the chosen fictional inputs; it does not estimate what happened to a Nigerian buyer or explain an observed historical price change.
For an actual analysis, record the exchange-rate source, date and convention. Keep the original price alongside the converted value so another reader can reproduce the calculation. If alternative rates matter to the research question, present justified scenarios without relabelling a hypothetical rate as an observed transaction rate.
A price wedge is not a profit margin
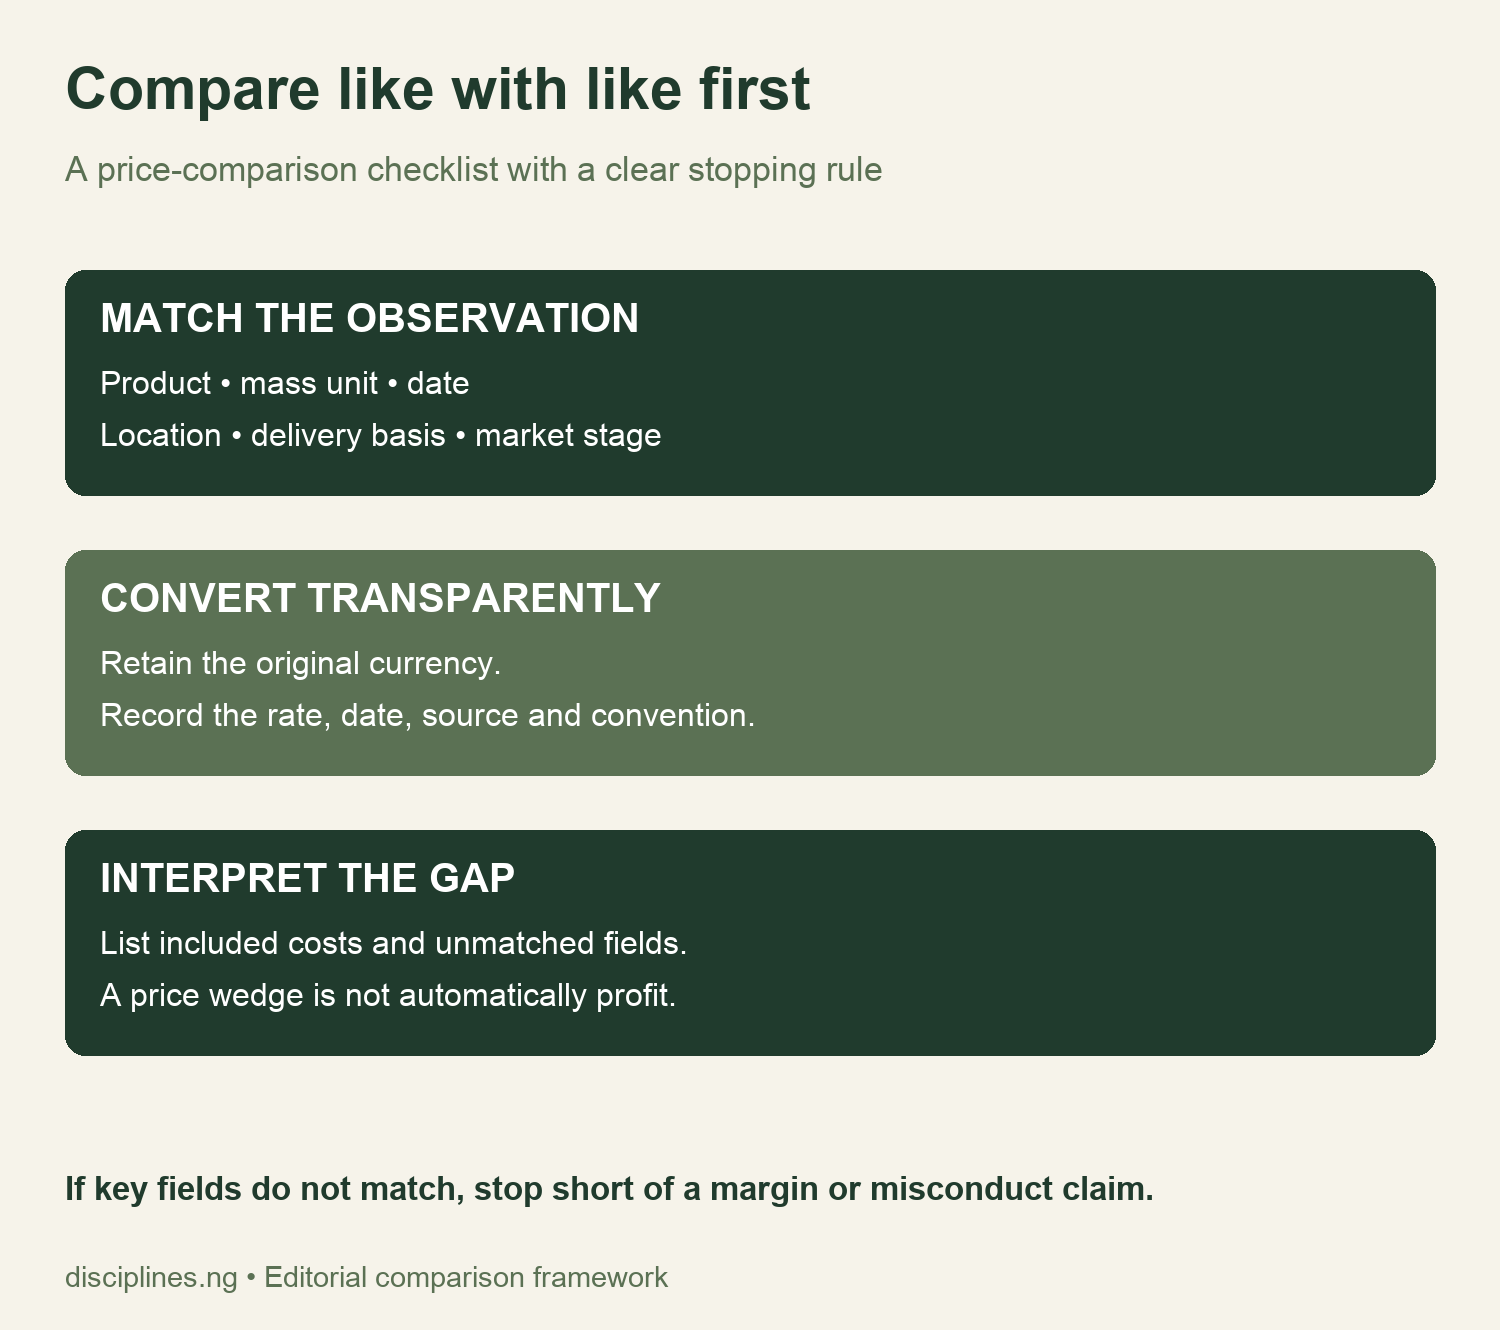
A price wedge is a defined difference between two price series. Before interpreting it, list what each series includes: product specification, freight, handling, finance, taxes, distribution, timing and market stage. Some components may be missing or measured on another basis.
A margin claim needs appropriately matched revenue and cost evidence. An allegation about market conduct needs a separate evidential basis. Do not name a firm as exploiting farmers merely because a local series lies above an international benchmark.
Separate market structure from a causal price explanation
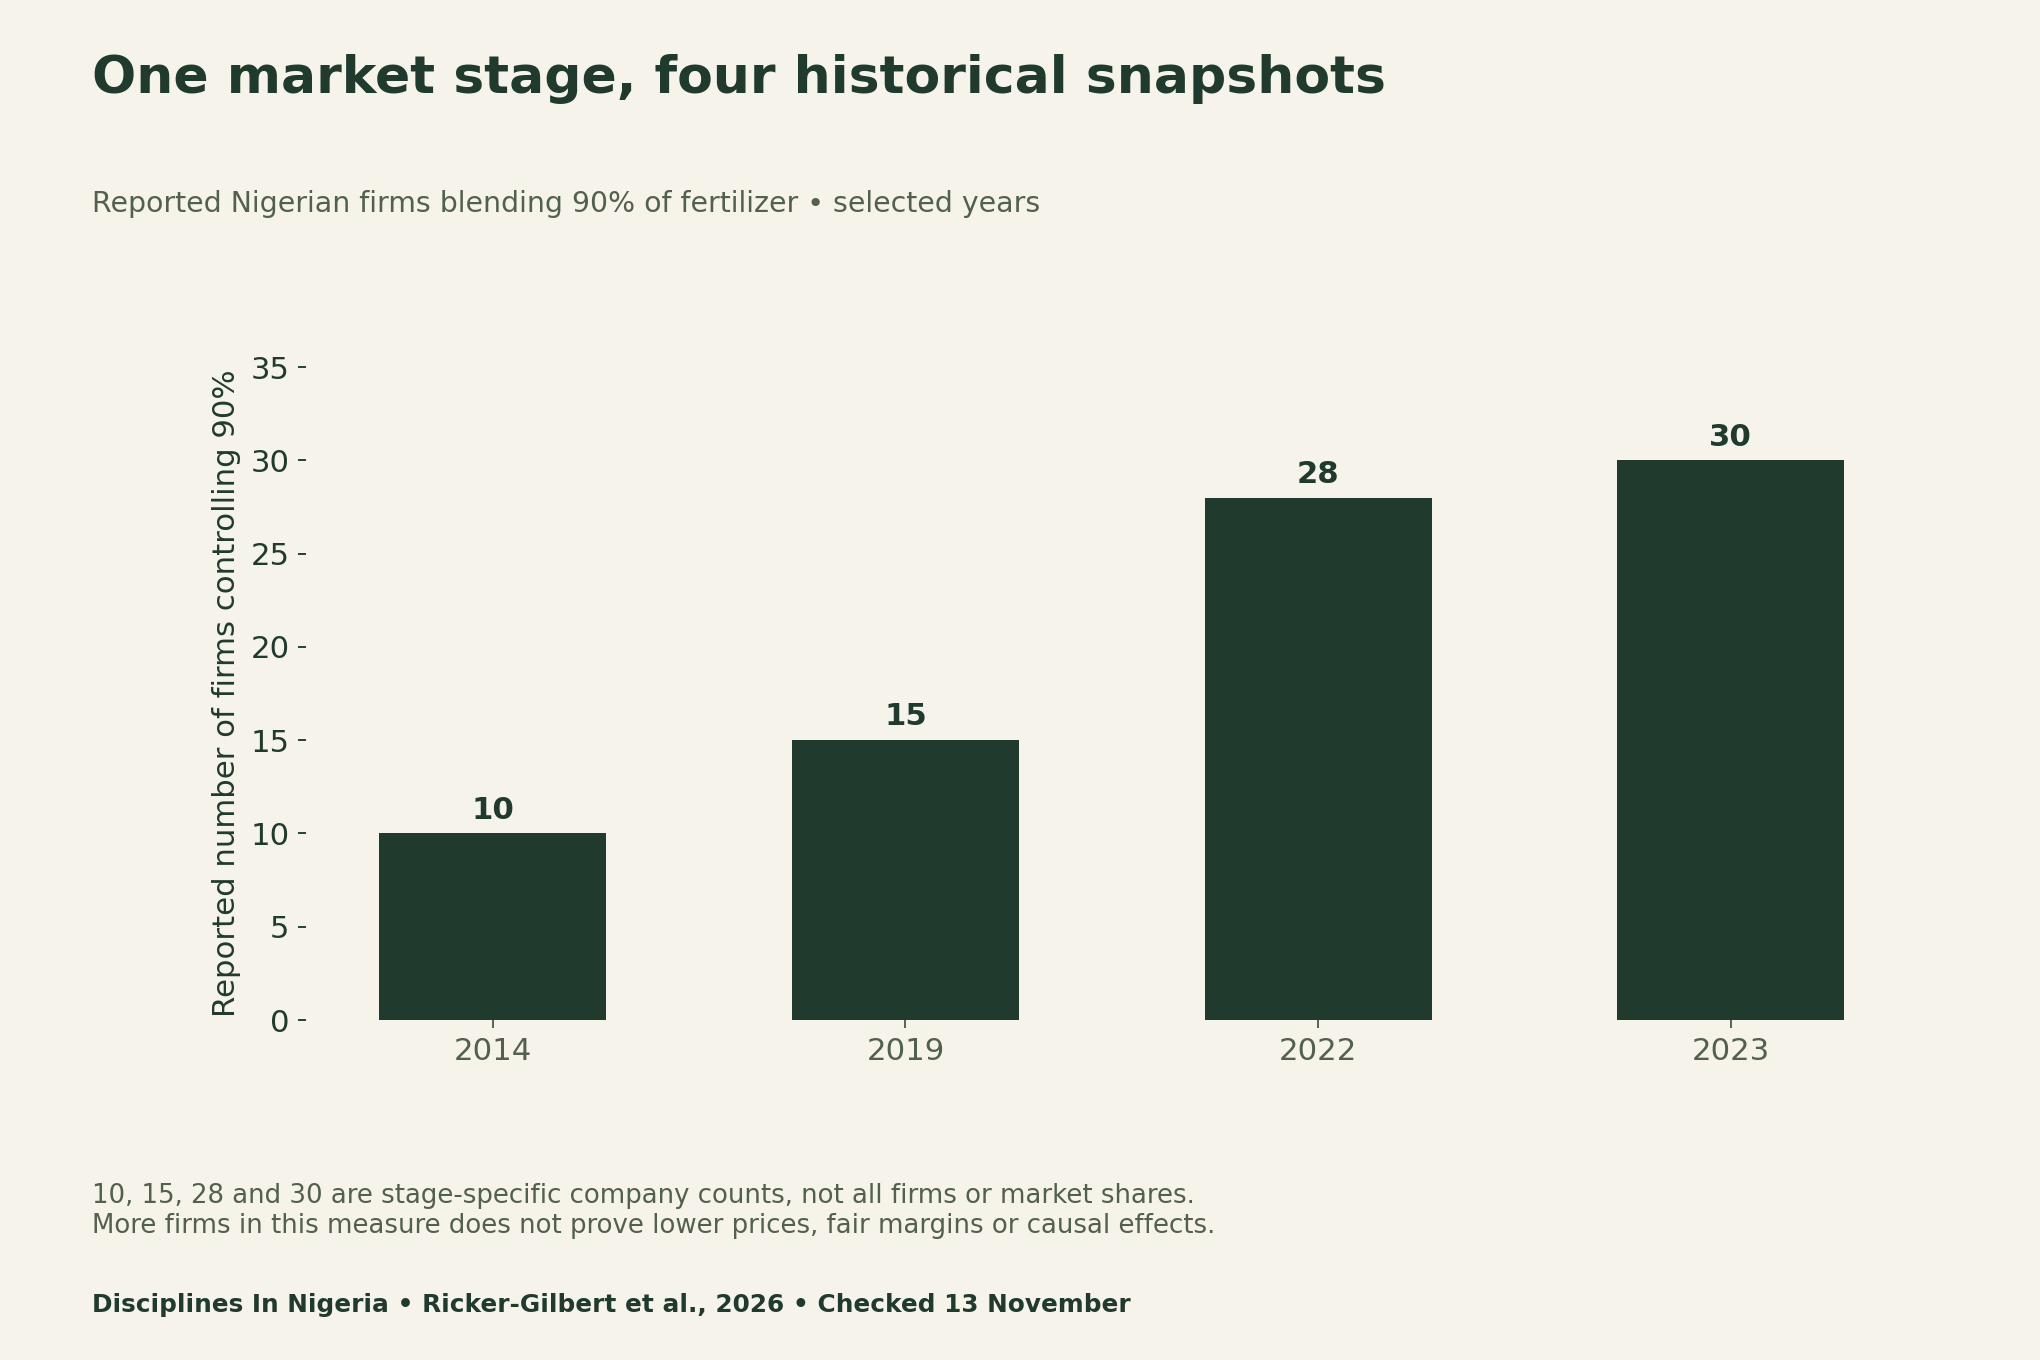
Structure measures need their own definitions. A count of firms covering a stated share differs from a concentration index based on individual shares. Also, importing, blending, wholesaling and retailing are different stages. A conclusion about one should not quietly become a claim about the entire chain.
Use the structure evidence to formulate a question, then ask what design could test it. Exchange rates, logistics, stock timing and policy can change alongside firm counts. A simple before-and-after comparison does not isolate the contribution of market structure.
Keep expert evidence and representative estimates separate
The paper reports 14 purposively selected interviews. Appendix 2 places those interviews in February–June 2024; the December 2023–May 2024 period refers to expert questionnaires by email. These activities provide context, not a statistically representative estimate of every farmer’s or trader’s experience.
For your own interview matrix, separate what an informant observed from their interpretation. Record the period and value-chain role, then seek corroborating or contradictory evidence. Preserve disagreement rather than counting several expert opinions as a population percentage.
Use a comparison framework before plotting a local series
For an indexed trend, choose and explain a base period, preserve missing observations and keep the units consistent. A value of 100 is a reference level, not a price quotation. If the underlying monthly observations are unavailable, do not draw a smooth Nigeria trend from a few source-chart pixels.
We have not obtained an independently reusable monthly Nigerian price-and-rate dataset for this guide. Therefore, we do not publish an observed indexed NGN-versus-USD series. The fictional conversion worksheet demonstrates the method without inventing observations or implying access to data we do not have.
Fertilizer price analysis in Nigeria: exchange-rate research tools
The source-values file retains the historical benchmarks and blending-stage counts. The fictional worksheet records its inputs and arithmetic explicitly. The Nigeria-focused dictionary and blank interview matrix help document comparable observations and evidence limits. They are original editorial aids, not a validated market model.
- Selected historical benchmarks and Nigeria blender counts (CSV)
- Explicitly fictional currency-conversion worksheet (CSV)
- Nigeria fertilizer-price data dictionary (CSV)
- Blank interview and corroboration matrix (CSV)
For related research boundaries, see our model-validation guide and school-community outcomes guide. Both explain why a useful indicator still needs a carefully limited interpretation.
Methods, limitations and citation
We checked the primary publisher article on 13 November 2026. The historical charts transcribe selected published facts; the conversion chart uses only stated fictional inputs. Its checks are 500 × 500 = 250,000 and 350 × 1,500 = 525,000. No current quotation, matched margin or causal estimate is produced.
Suggested citation: Disciplines In Nigeria, 13 November 2026, “Fertilizer Price Research in Nigeria: Separate Currency Effects From Market Structure”, with Ricker-Gilbert et al., DOI 10.1186/s40066-026-00651-7. Retain the historical dates, purposive-sample limit and fictional-example labels when reusing the figures. Check actual specifications and current quotations for a purchasing decision.


