






Response surface methodology validation in Nigeria needs more than an attractive optimum. A fitted model can suggest where a response might improve. Independent tests, a clear error definition and suitable measurements determine how far that prediction can support a claim.
A new refinery-effluent study provides a useful teaching case. This guide separates predicted efficiency, independent deviation and deployment evidence. It includes two charts, an evidence-gate infographic and four free CSV tools for chemistry and engineering researchers. It is not an experimental protocol or a claim of safe effluent.
Response surface methodology validation in Nigeria: read the version
The accepted BMC Chemistry article by Okoduwa and colleagues, published 9 November 2026, describes 30 runs and four experimental factors. It concerns extraction using a hydrophobic deep eutectic solvent. The publisher warns that this accepted version may receive further edits before the final version of record.
Keep predicted optima separate from demonstrated performance
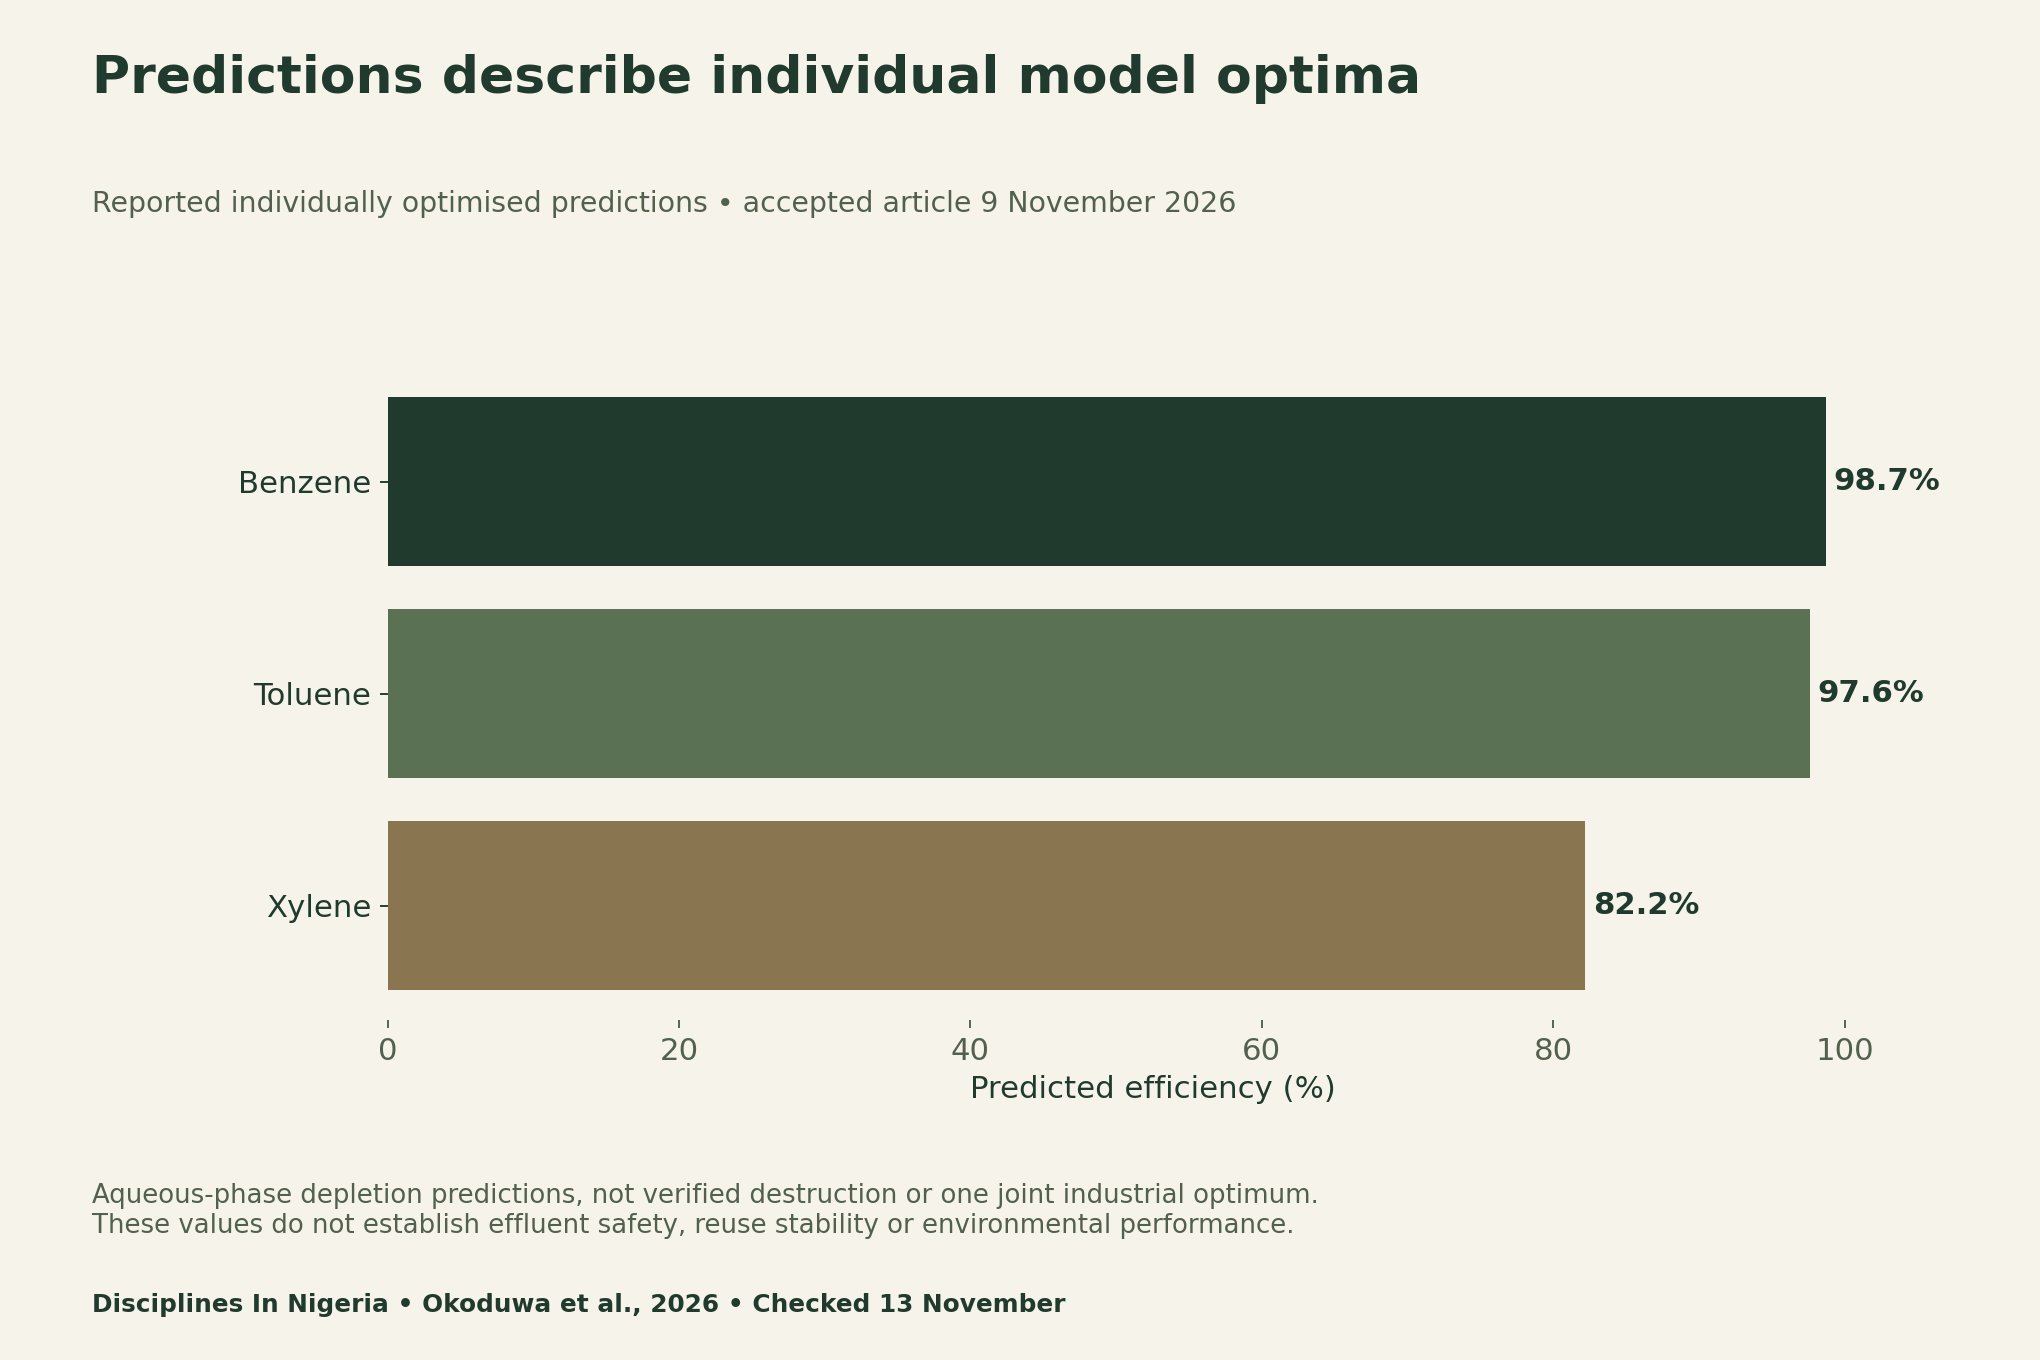
For any optimisation paper, record what the model predicts and the conditions to which it applies. Separate a proposed setting from a measured response. If several outcomes have different optima, ask whether the paper actually tested a joint operating choice rather than assuming that all maxima occur together.
Read the independent validation result on its own scale
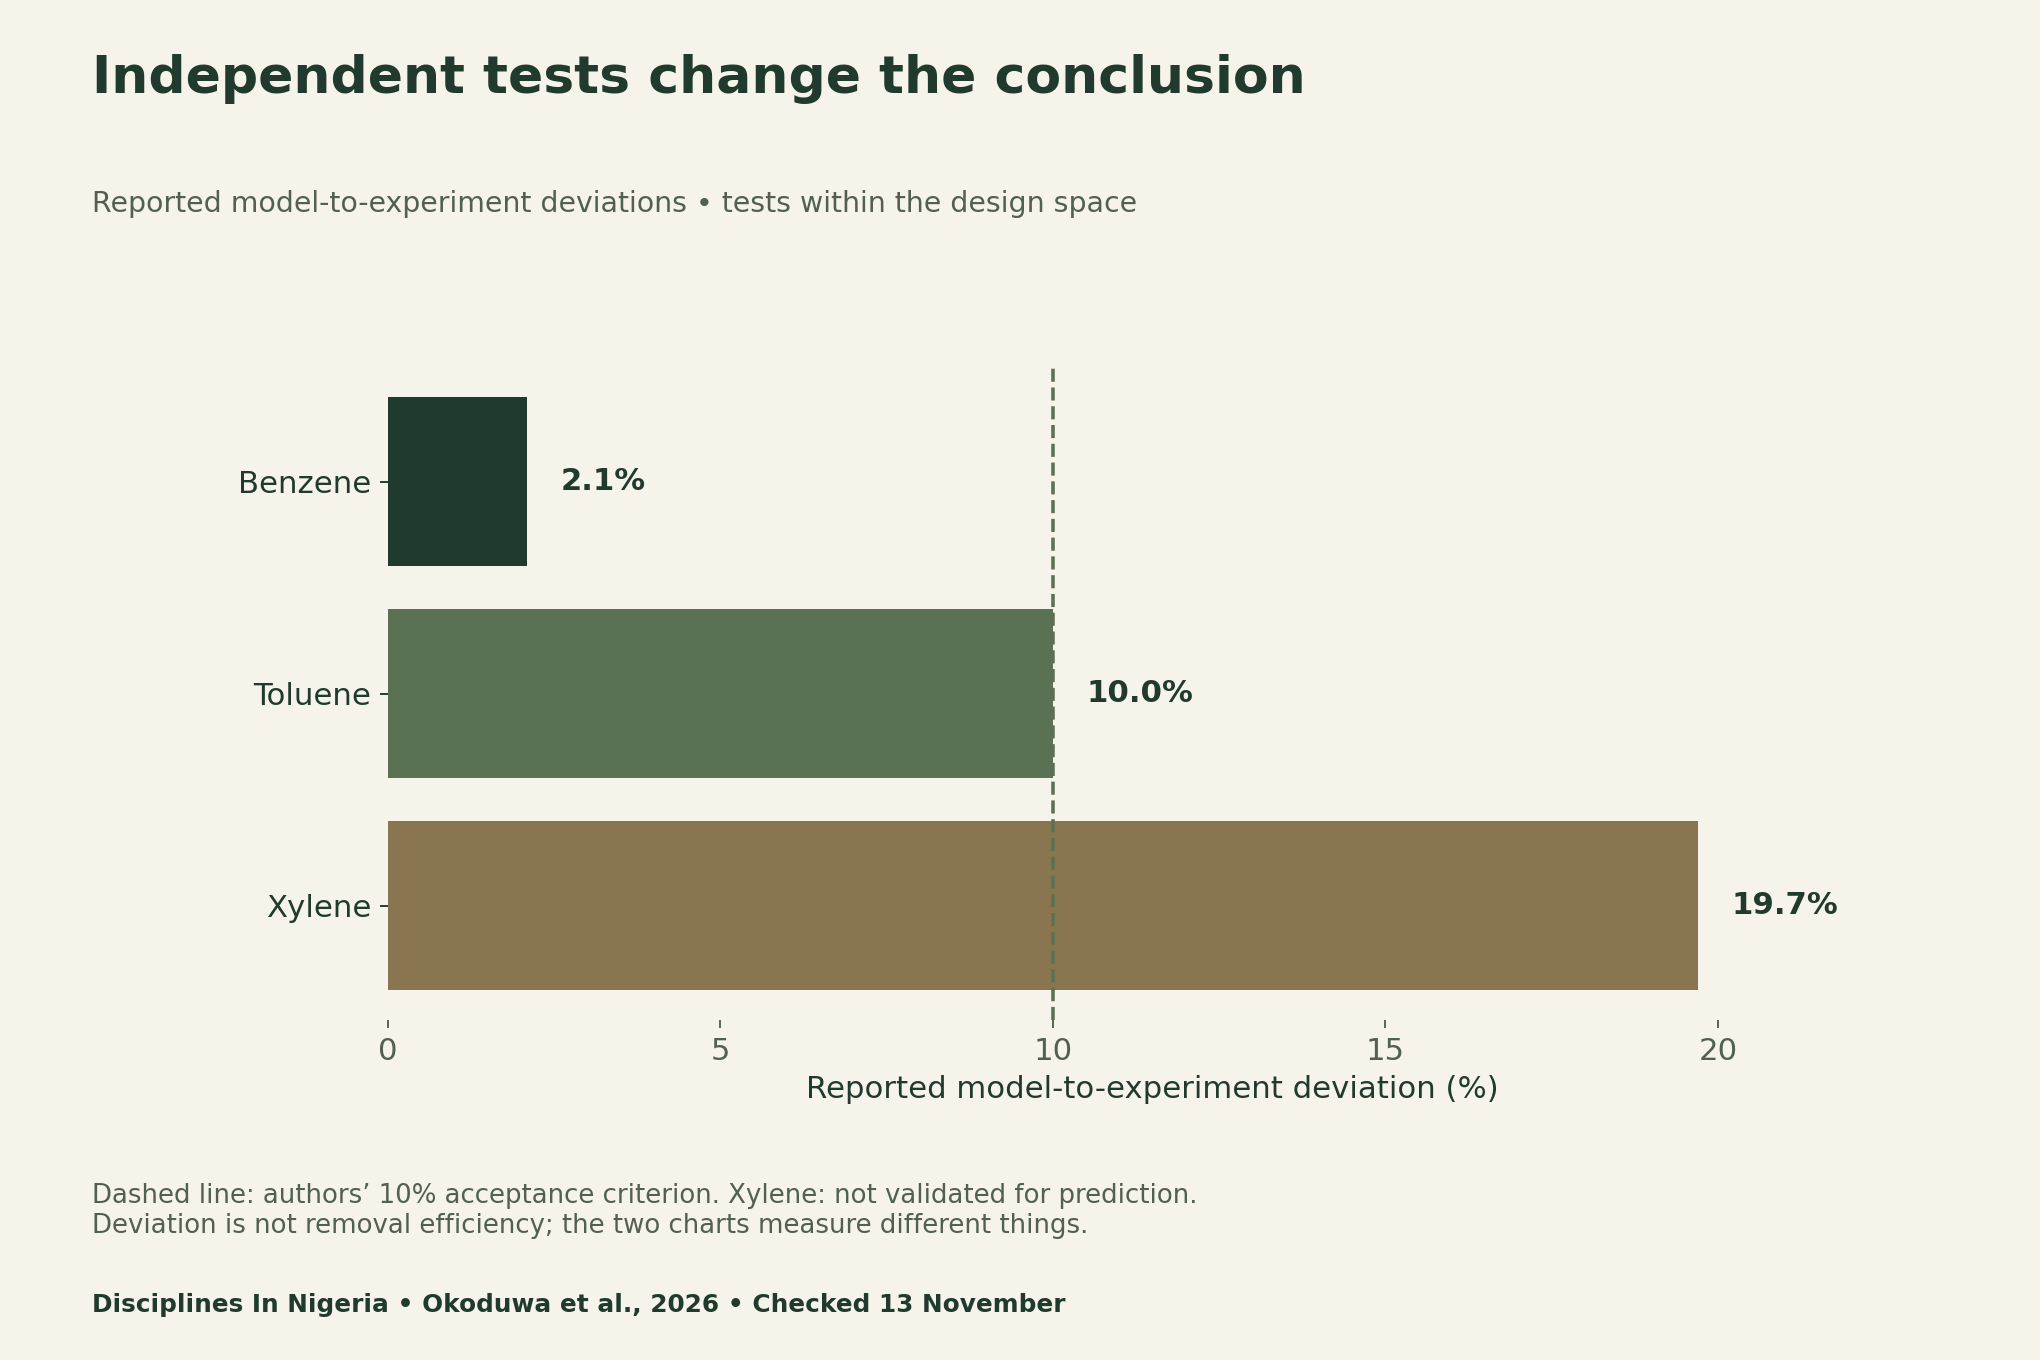
The xylene result changes the conclusion a reader can defend. Do not promote its predicted optimum as a validated prediction. Also avoid treating a criterion met within one design space as universal assurance across other matrices, facilities or operating conditions.
When evaluating another study, find the error formula and its denominator. A percentage deviation can mean different things under different definitions. Preserve the author’s stated metric; do not relabel it as percentage-point error, uncertainty or failure rate without the underlying definition and observations.
A fitted model and a validated prediction answer different questions
A model-fit statistic summarises an aspect of agreement with the data used for fitting. Independent validation asks how predictions compare with additional observations under a specified test. A favourable fit does not remove the need to inspect residuals, assumptions, response transformations and the independence of test data.
Use the blank audit to identify which design points belong to fitting and which belong to validation. Record whether the test lies inside the fitted range. Extrapolation needs its own justification; a smooth response surface outside the observed range is still a model output.
Aqueous-phase depletion is not proof of destruction
The paper reports UV-Vis estimates of aqueous-phase depletion and acknowledges no solvent-free controls or chromatographic confirmation. Environmental performance and reuse stability were not assessed. Those limits matter when choosing words such as removal, destruction, selective extraction, green or ready for deployment.
A decrease in one measured phase does not, by itself, account for where the material went. For a stronger fate claim, a qualified research team would need appropriate analytical and mass-balance evidence. Our guide does not prescribe hazardous handling, experimental settings or treatment for real effluent.
Use evidence gates to limit the conclusion
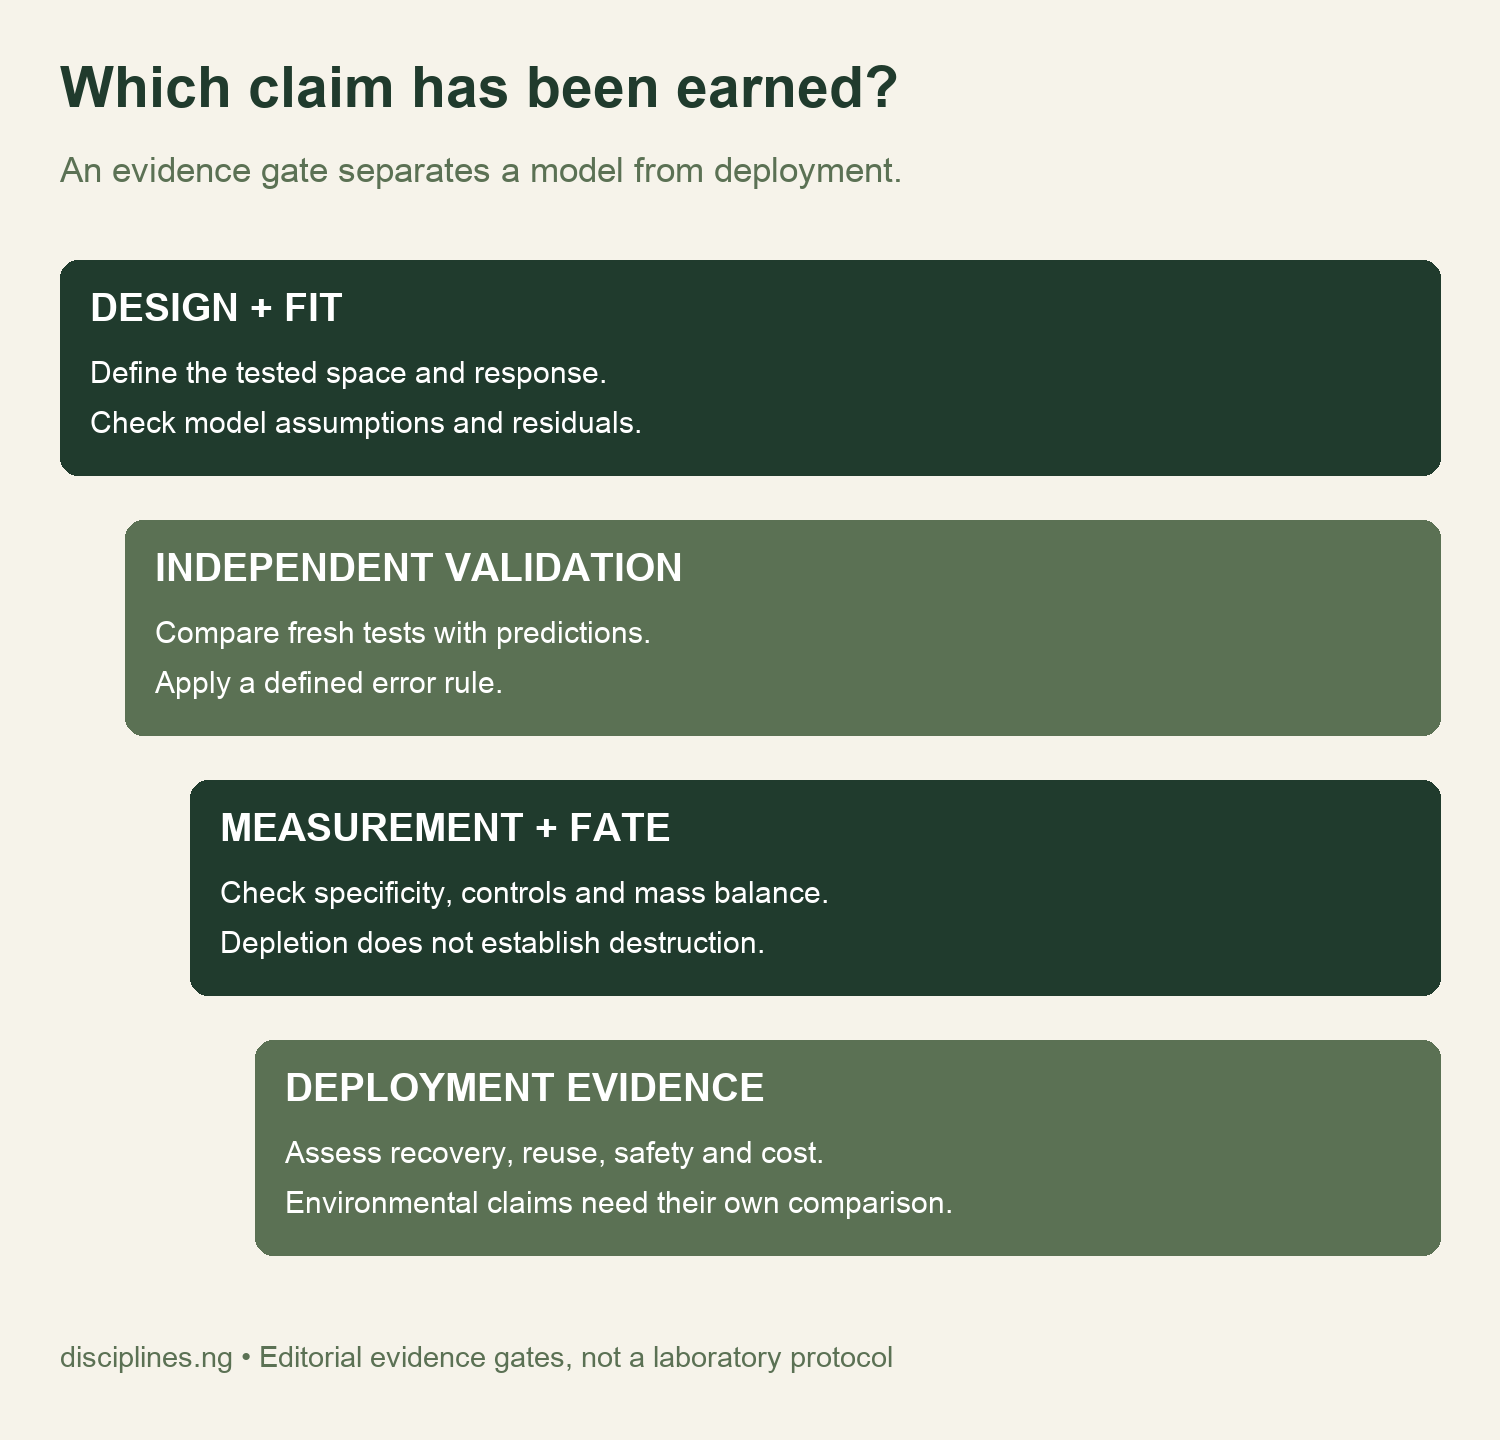
First, state the design and response. Then identify the independent test and acceptance rule. Next, examine the measurement’s specificity and the fate claim. Finally, list which operational and environmental questions require additional work. Keep an unresolved gate visible rather than treating it as a presumed success.
Build a claim-to-evidence register
Write each proposed headline or conclusion in a separate row. For example, “the model predicts a response” needs different evidence from “the process is commercially viable”. Link each statement to the exact table, test or document supporting it, then state the narrowest defensible wording.
This register can help a dissertation discussion avoid drifting beyond its results. It also makes review easier: a supervisor can see which claims depend on measured data and which remain future research questions. The register itself is an editorial aid, not a validated assessment scale.
Ask what changes when the matrix changes
A simulated solution and a real effluent may differ in composition and analytical interference. A result in one does not automatically transfer to every other sample. Record the matrix, response definition and validation conditions before comparing studies.
Likewise, a short test does not settle long-term solvent recovery, repeated reuse, equipment compatibility or operating cost. Those questions can be important without being answered by the current experiment. Frame them as evidence needs rather than inventing a commercial forecast.
Response surface methodology validation in Nigeria: free tools
The two source-value files keep predictions and deviations in separate datasets. The blank model audit records design, fit, validation and measurement questions. The claim register links a proposed conclusion to supporting evidence and an explicit limit. Use these tools privately without sending laboratory data to us.
- Reported individual model predictions (CSV)
- Reported independent-test deviations (CSV)
- Blank RSM model and validation audit (CSV)
- Blank claim-to-evidence register (CSV)
For a related scope problem, read our water quality index limitations guide. Our school-community research guide also distinguishes a reported indicator from the wider outcome a reader might infer.
Methods, limitations and citation
We checked the primary publisher’s accepted-article page on 13 November 2026 and transcribed its selected predictions and independent deviations. The charts preserve the two different measures. We did not refit the models, inspect raw run-level data or independently validate analytical performance. The version may change, so later readers should check the final record.
Suggested citation: Disciplines In Nigeria, 13 November 2026, “Refinery Wastewater Research in Nigeria: Predicted Removal Is Not Validated Performance”, alongside Okoduwa et al., DOI 10.1186/s13065-026-01958-z. The infographic and worksheets are original organising tools. No claim of safe water, validated xylene prediction, proven green chemistry or commercial viability is made.


