






Health insurance research in Nigeria needs three dates beside its headline: when people were surveyed, when a relevant policy began and when the paper was published. A newly released article may describe an earlier setting. Reading the publication date as the measurement date can therefore change a policy conclusion without adding any evidence.
This guide uses an Ogun State survey as a worked research-design example. Three original charts, a policy-exposure decision tree and four CSV tools separate a historical coverage result from an evaluation of a later programme. It provides no current premium, eligibility, treatment or benefit advice. Research checked on 9 November 2026.
Put fieldwork before the publication headline
The Babatunde and colleagues paper published on 5 November 2026 collected observations in May–August 2024. It analysed 992 adults receiving antiretroviral treatment at eight selected Ogun facilities. The accepted manuscript’s methods, pages 4–5, provide the collection period. It is an early version subject to further editing.
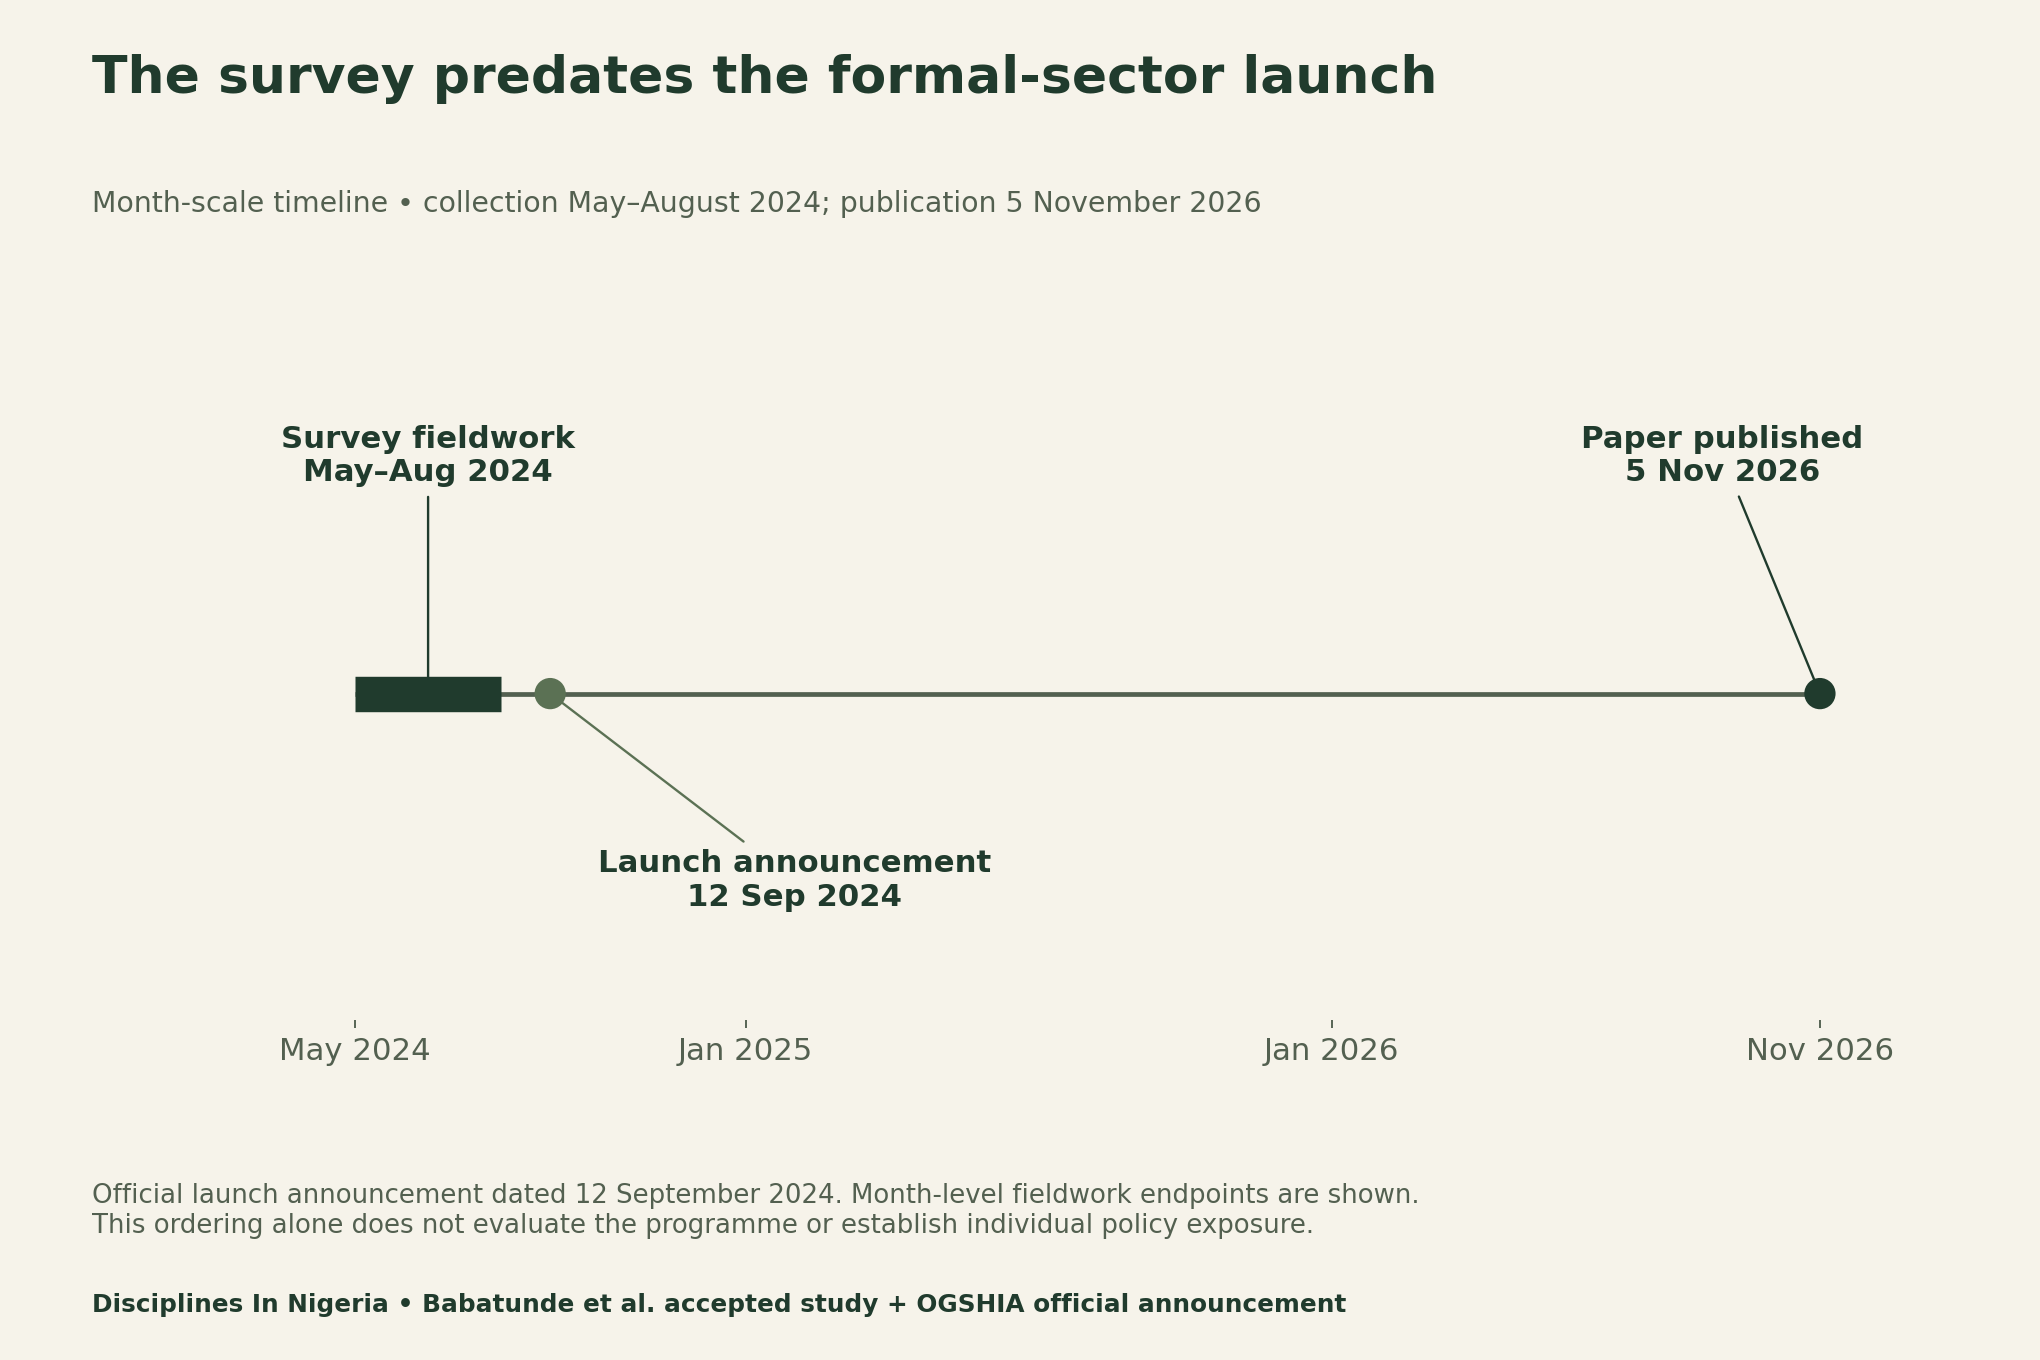
The official OGSHIA announcement dated 12 September 2024 describes the formal-sector launch and emphasizes state and local government staff. That supplies an independent timing check. It does not establish whether any sampled individual later became eligible, enrolled or received a particular benefit.
Health insurance research Nigeria: preserve the sample boundary
The study reports 85 insured respondents and 907 uninsured respondents. Calculating 85 divided by 992 gives 8.57%, which rounds to its 8.6% headline. This describes the sampled treatment attendees during fieldwork. It is not an estimate for all Ogun residents, all Nigerians or everyone living with HIV.
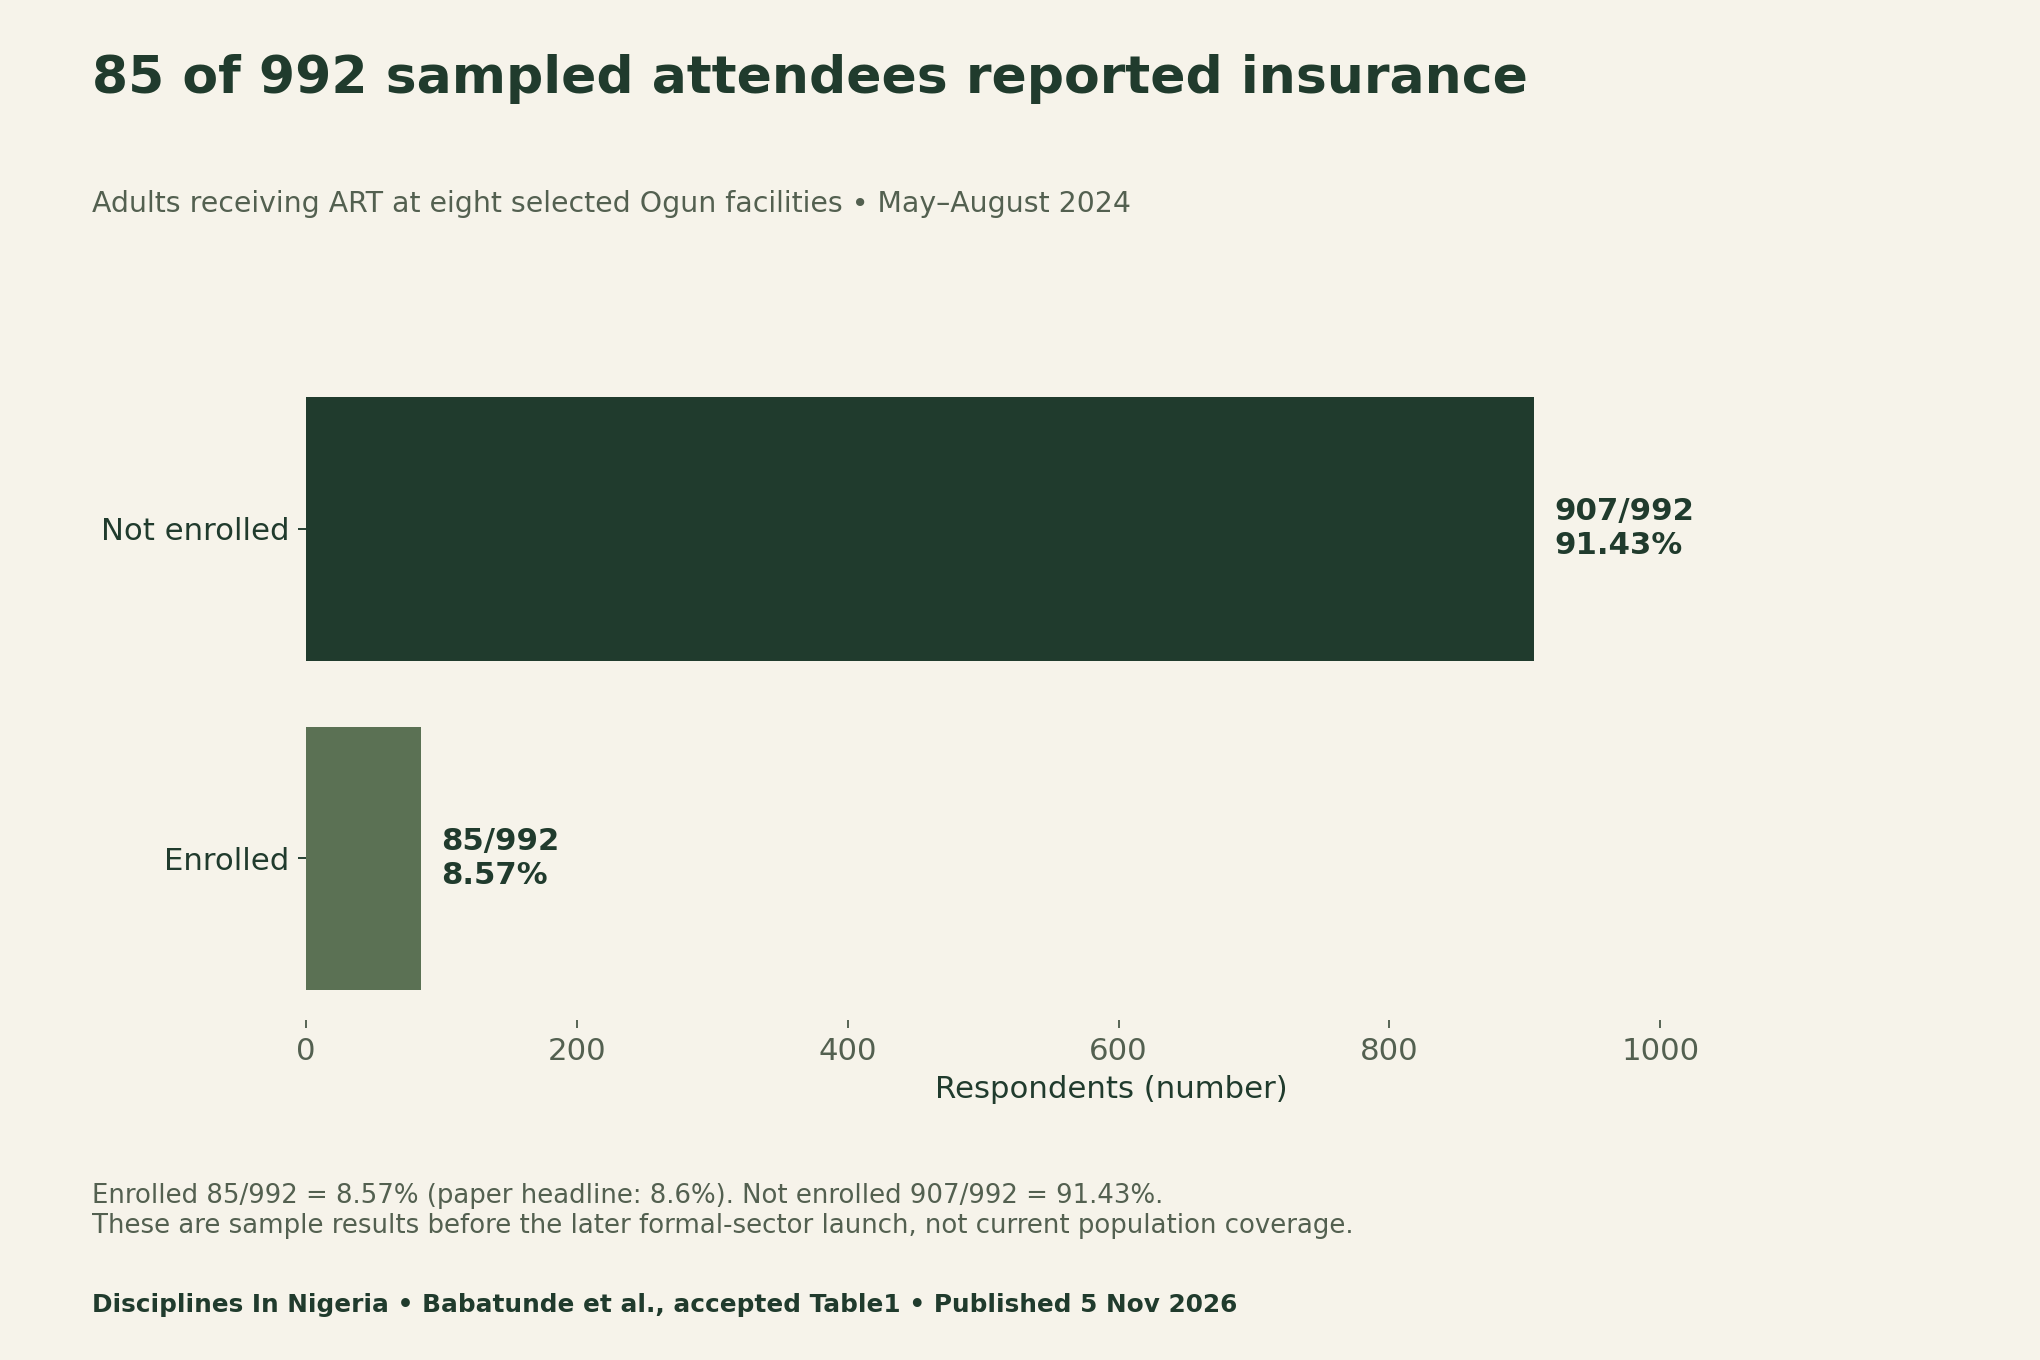
For a policy audit, write the target population and the sampled population in separate fields. Ask whether they overlap and what evidence establishes that overlap. Similar geography alone does not make them interchangeable. A facility-based sample also cannot automatically describe people outside those facilities or outside care.
A historical survey can still be useful. It can describe a sampled setting before a change and help plan a comparable follow-up. Calling it a baseline is a statement about timing and scope, not proof that a later difference would be caused by the policy. A valid comparison needs more design information.
Read the barrier question before naming its denominator
The paper reports premium unaffordability at 26.0% and never having heard of insurance at 23.7%. Supplementary questionnaire Question 12 routes uninsured respondents to a “best describes” reason. The discussion also identifies the uninsured group. The exact completed item denominator is not stated separately in Figure 3, so we do not reconstruct barrier counts.
This is why a reader should inspect response routing before borrowing an abstract percentage. Record who was eligible to answer, whether one answer or several were requested, and how missing answers were handled. “Best describes” is different from an explicit “select all” instruction. Our ledger retains that distinction rather than assuming overlapping categories.
The coverage denominator is verified as 992; the eligible uninsured group is 907. Those facts do not by themselves establish the final number answering every item. A repeat survey should report both the eligible and completed counts. Avoid turning these historical reasons into current scheme prices or individual entitlement guidance.
Adjusted odds are associations, not programme effects
The study reports adjusted odds ratios of 4.89 for tertiary education, 2.81 for the highest income group and 2.15 for home ownership, with the confidence intervals shown below. They describe associations in this historical survey. They do not measure the effect of the later formal-sector programme.
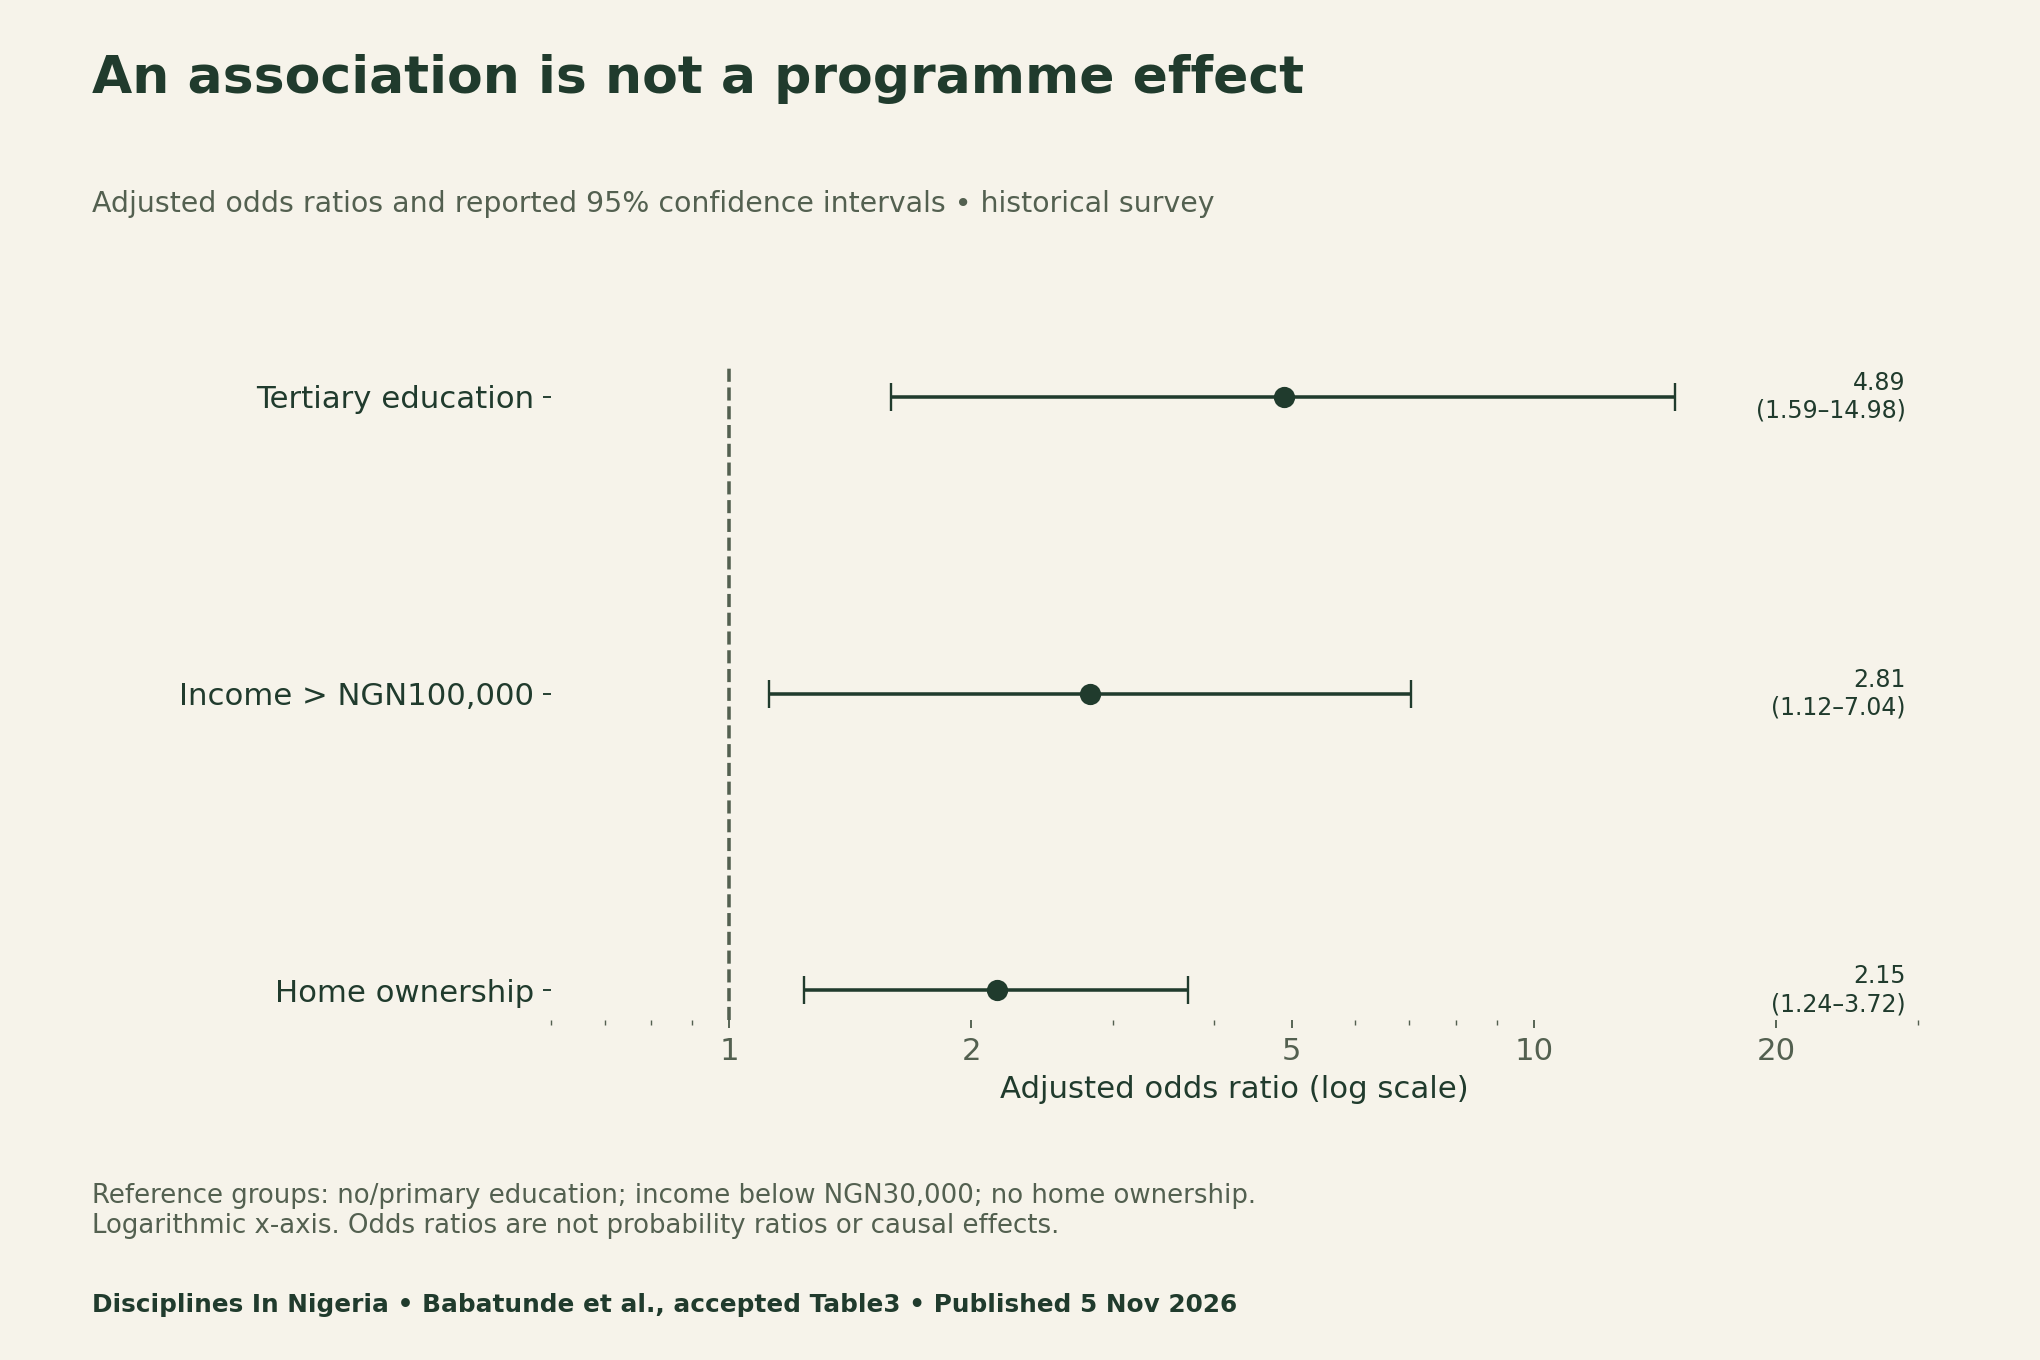
An odds ratio compares odds under the model’s stated categories and adjustments. It is not the same as multiplying a person’s probability of coverage. A confidence interval also does not resolve every possible source of selection or measurement error. Keep the comparator, outcome and design beside the estimate before writing a policy claim.
Use a policy-exposure decision tree
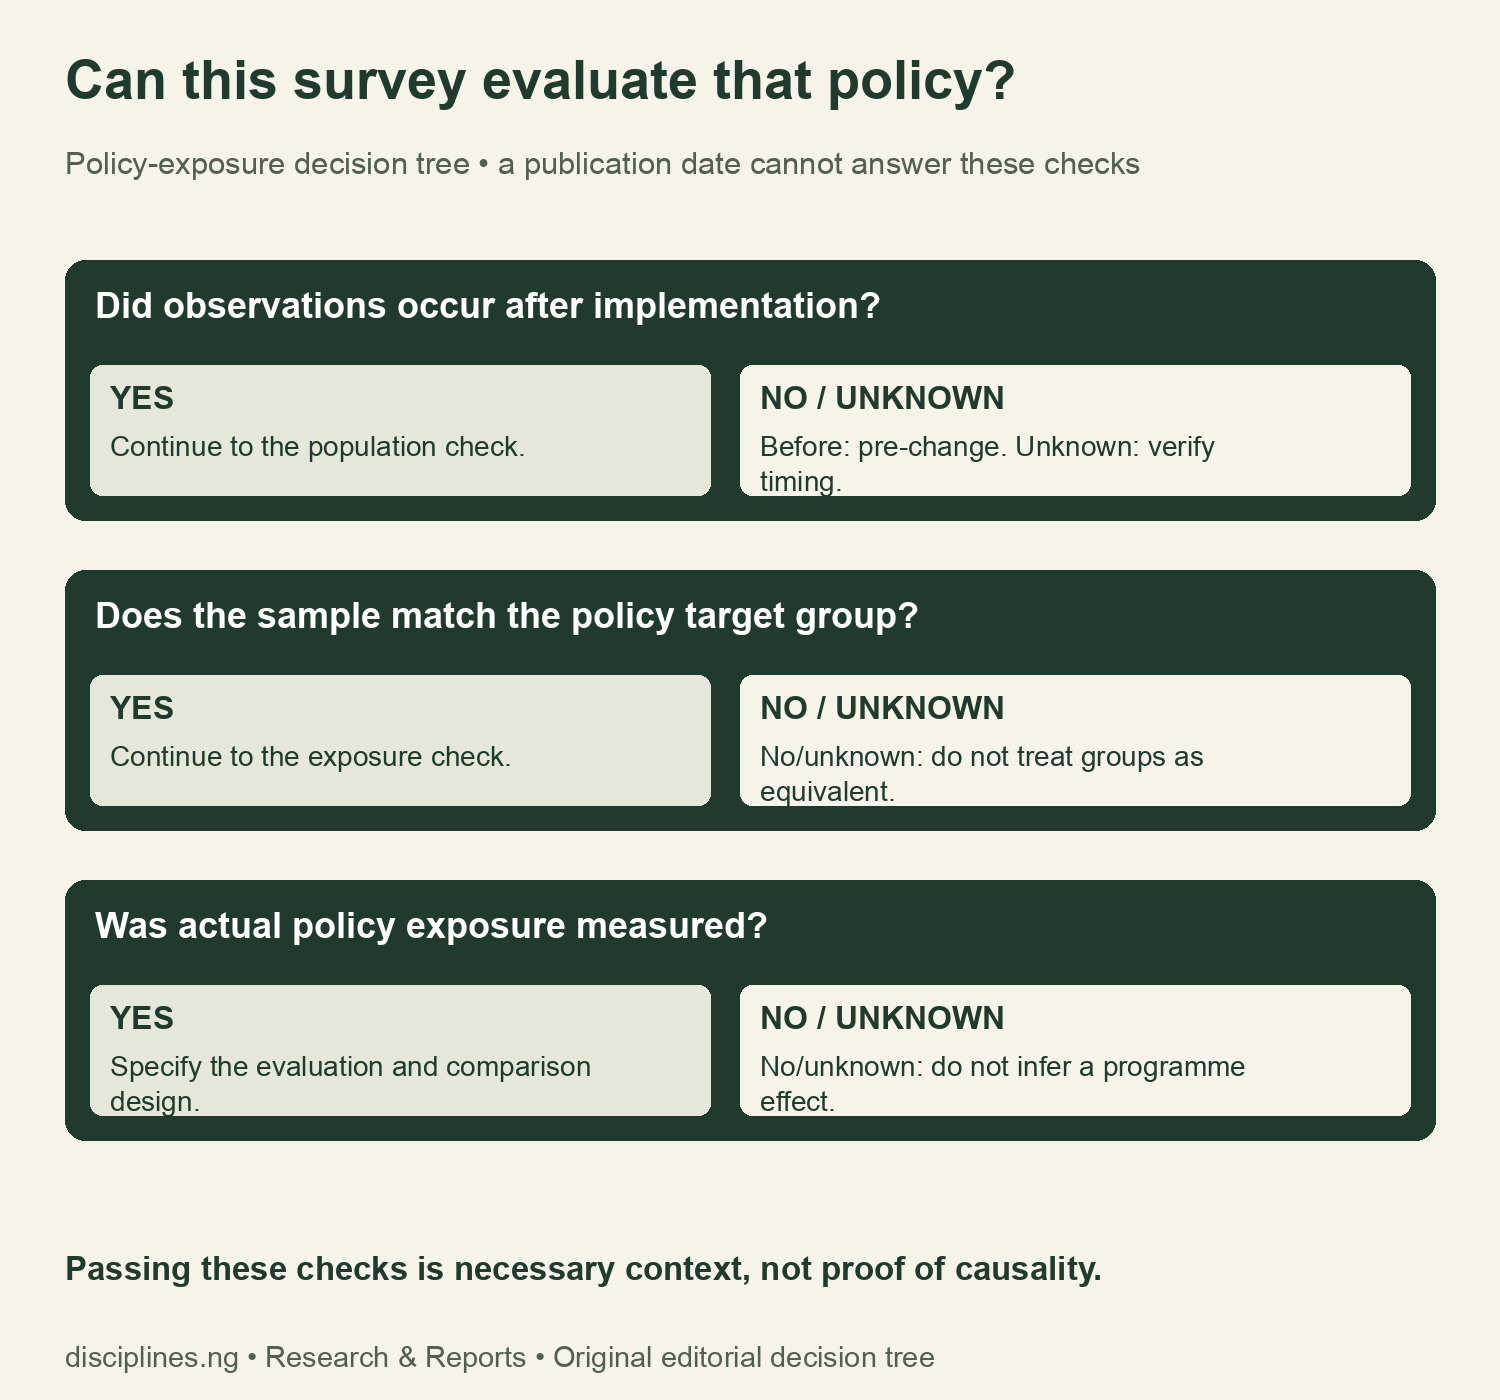
Begin with time order. Then inspect eligibility and actual exposure, which are separate concepts. A launch announcement does not show that everyone in a region was covered from that day. Likewise, knowing a programme exists does not establish enrolment, duration of membership or use of services. Define those measures before comparing outcomes.
If a check is unresolved, narrow the claim. A defensible sentence might describe coverage among sampled attendees during a stated period. A stronger sentence about a programme’s success requires evidence matching that programme, population, exposure and outcome. Do not fill missing links with the publication year.
Specify a comparable follow-up before collecting it
Our blank repeat-survey specification is a proposal, not a completed evaluation. It asks researchers to record the sampling frame, facility selection, eligibility, recruitment, question wording, response routing and definition of coverage. It also separates awareness, eligibility and actual enrolment rather than treating them as one variable.
Specify the fieldwork and recall period, a suitable comparison arrangement and alternative explanations for any change. Changes in facility mix, respondent composition or questionnaire wording can complicate a before/after comparison. Preserve original definitions where appropriate and document deliberate changes. Do not claim a causal effect from two percentages alone.
Plan consent, ethics review, access controls and missing-item reporting before collecting sensitive information. Public tools should contain no patient names, treatment identifiers, contact details or individual health histories. Our downloadable templates use blank design fields only. They are not a patient-registration system or a request for personal records.
For another example of keeping observation and treatment clocks separate, see our research timing guide. Our correlation interpretation guide explains the related boundary between an association and an intervention effect.
Download the date ledger and claim-audit tools
The date ledger records fieldwork, the official announcement and publication with source locations. The measure file preserves coverage counts, association intervals and the barrier denominator caveat. Two blank tools make a policy claim and a repeat-survey plan reviewable before anyone collects new observations.
- Survey, policy and publication date ledger (CSV)
- Historical coverage and association source measures (CSV)
- Blank policy-claim audit (CSV)
- Blank repeat-survey design specification (CSV)
Methods, limitations and citation
For this health insurance research Nigeria guide, we inspected the publisher page, accepted PDF, supplementary questionnaire and official agency announcement. We transcribed selected aggregate facts, calculated coverage shares from 85 and 907 out of 992, and plotted the reported odds ratios and intervals. All charts, templates and the decision tree are original; no publisher figure or questionnaire is reproduced.
This is a methodological audit, not a current programme evaluation, insurance recommendation or clinical assessment. We have no individual-level records and did not estimate policy effects. The accepted version may change. The barrier item’s completed denominator remains unverified; the source file records that limitation explicitly.
Suggested citation: Disciplines In Nigeria (9 November 2026), “Health Insurance Research Nigeria: Read Survey Dates First,” date ledger and original research-design tools. Cite Babatunde and colleagues for the survey and OGSHIA for its dated launch announcement.


