



Maize fertilizer partial budgets in the Nigerian savanna show why a strong average needs a local check. A new six-location study reports the highest pooled yield and net benefit under its model recommendation. However, subtracting the control within each zone tells a more useful story for planning follow-up research.
The 19 November 2026 Discover Soil paper by Aiyelabegan, Lawan and Ayobami evaluated four nutrient strategies during the 2025 rainy season. We reproduce its budget table, calculate three clearly labelled contrasts and provide a blank partial-budget worksheet. These are historic trial results, not present-day fertilizer prices, predicted farm profits or application advice.
Read the maize fertilizer partial budget in its trial context
The field evaluation covered six locations: three in Kaduna’s Northern Guinea Savanna and three in Kano’s Sudan Savanna. Each location contained one plot of each strategy, giving 24 plots in total. Locations served as blocks. The strategies were the model recommendation, regional recommendation, a specified farmers’ practice and an unfertilised control.
That design provides a first prospective test. It does not represent every field, season or farming practice in either zone. There was no within-location replication for a strategy. Moreover, the researchers reported grain on an air-dry basis after seven days of drying, without moisture correction. Those details limit comparisons with other yield datasets.
Maize fertilizer partial budget: keep yield and margin separate
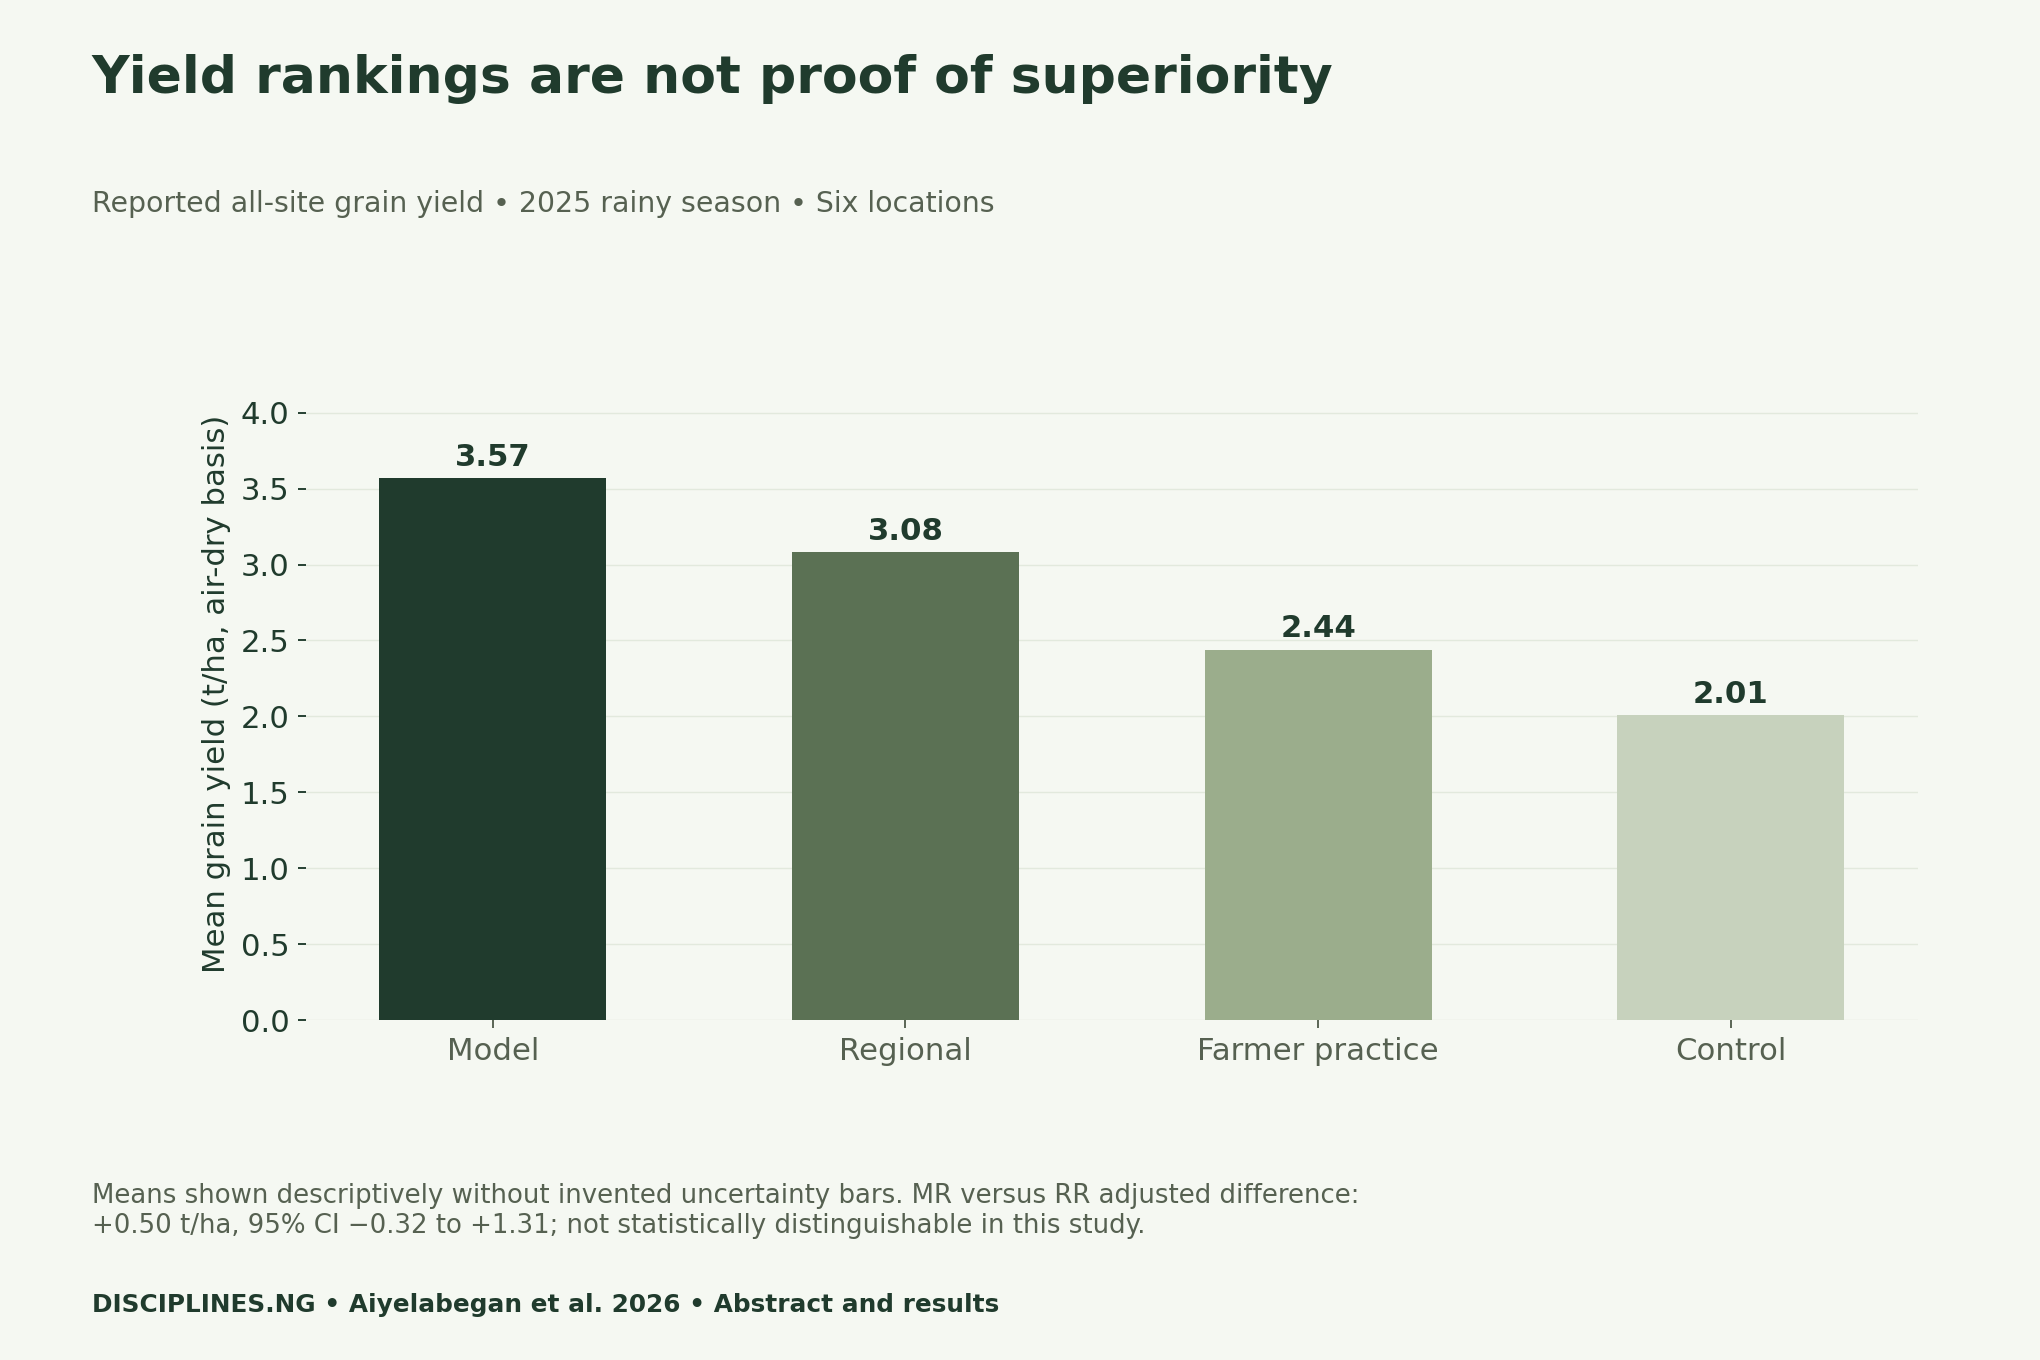
The model strategy’s mean was numerically highest. Yet its adjusted advantage over the regional strategy was not statistically distinguishable: 0.50 t/ha, with a 95% confidence interval from −0.32 to 1.31. Therefore, neither “proven higher yield” nor “proven equivalent yield” follows from that comparison. A non-significant result is not an equivalence test.
A partial budget asks a different question. It values grain and subtracts the variable costs included in that comparison. A higher yield can still produce a smaller margin if the added costs exceed the added field value. Consequently, retain the comparator, currency, price date and cost boundary whenever quoting a net benefit.
Recalculate the zone contrasts before using the pooled result
At the study’s reported maize price of US$0.236/kg, Table 9 gives model and control net benefits of US$1,191.05 and US$803.09 per hectare in the Northern Guinea Savanna. Their difference is +US$387.96/ha. In the Sudan Savanna, US$90.35 minus US$144.59 gives −US$54.24/ha.
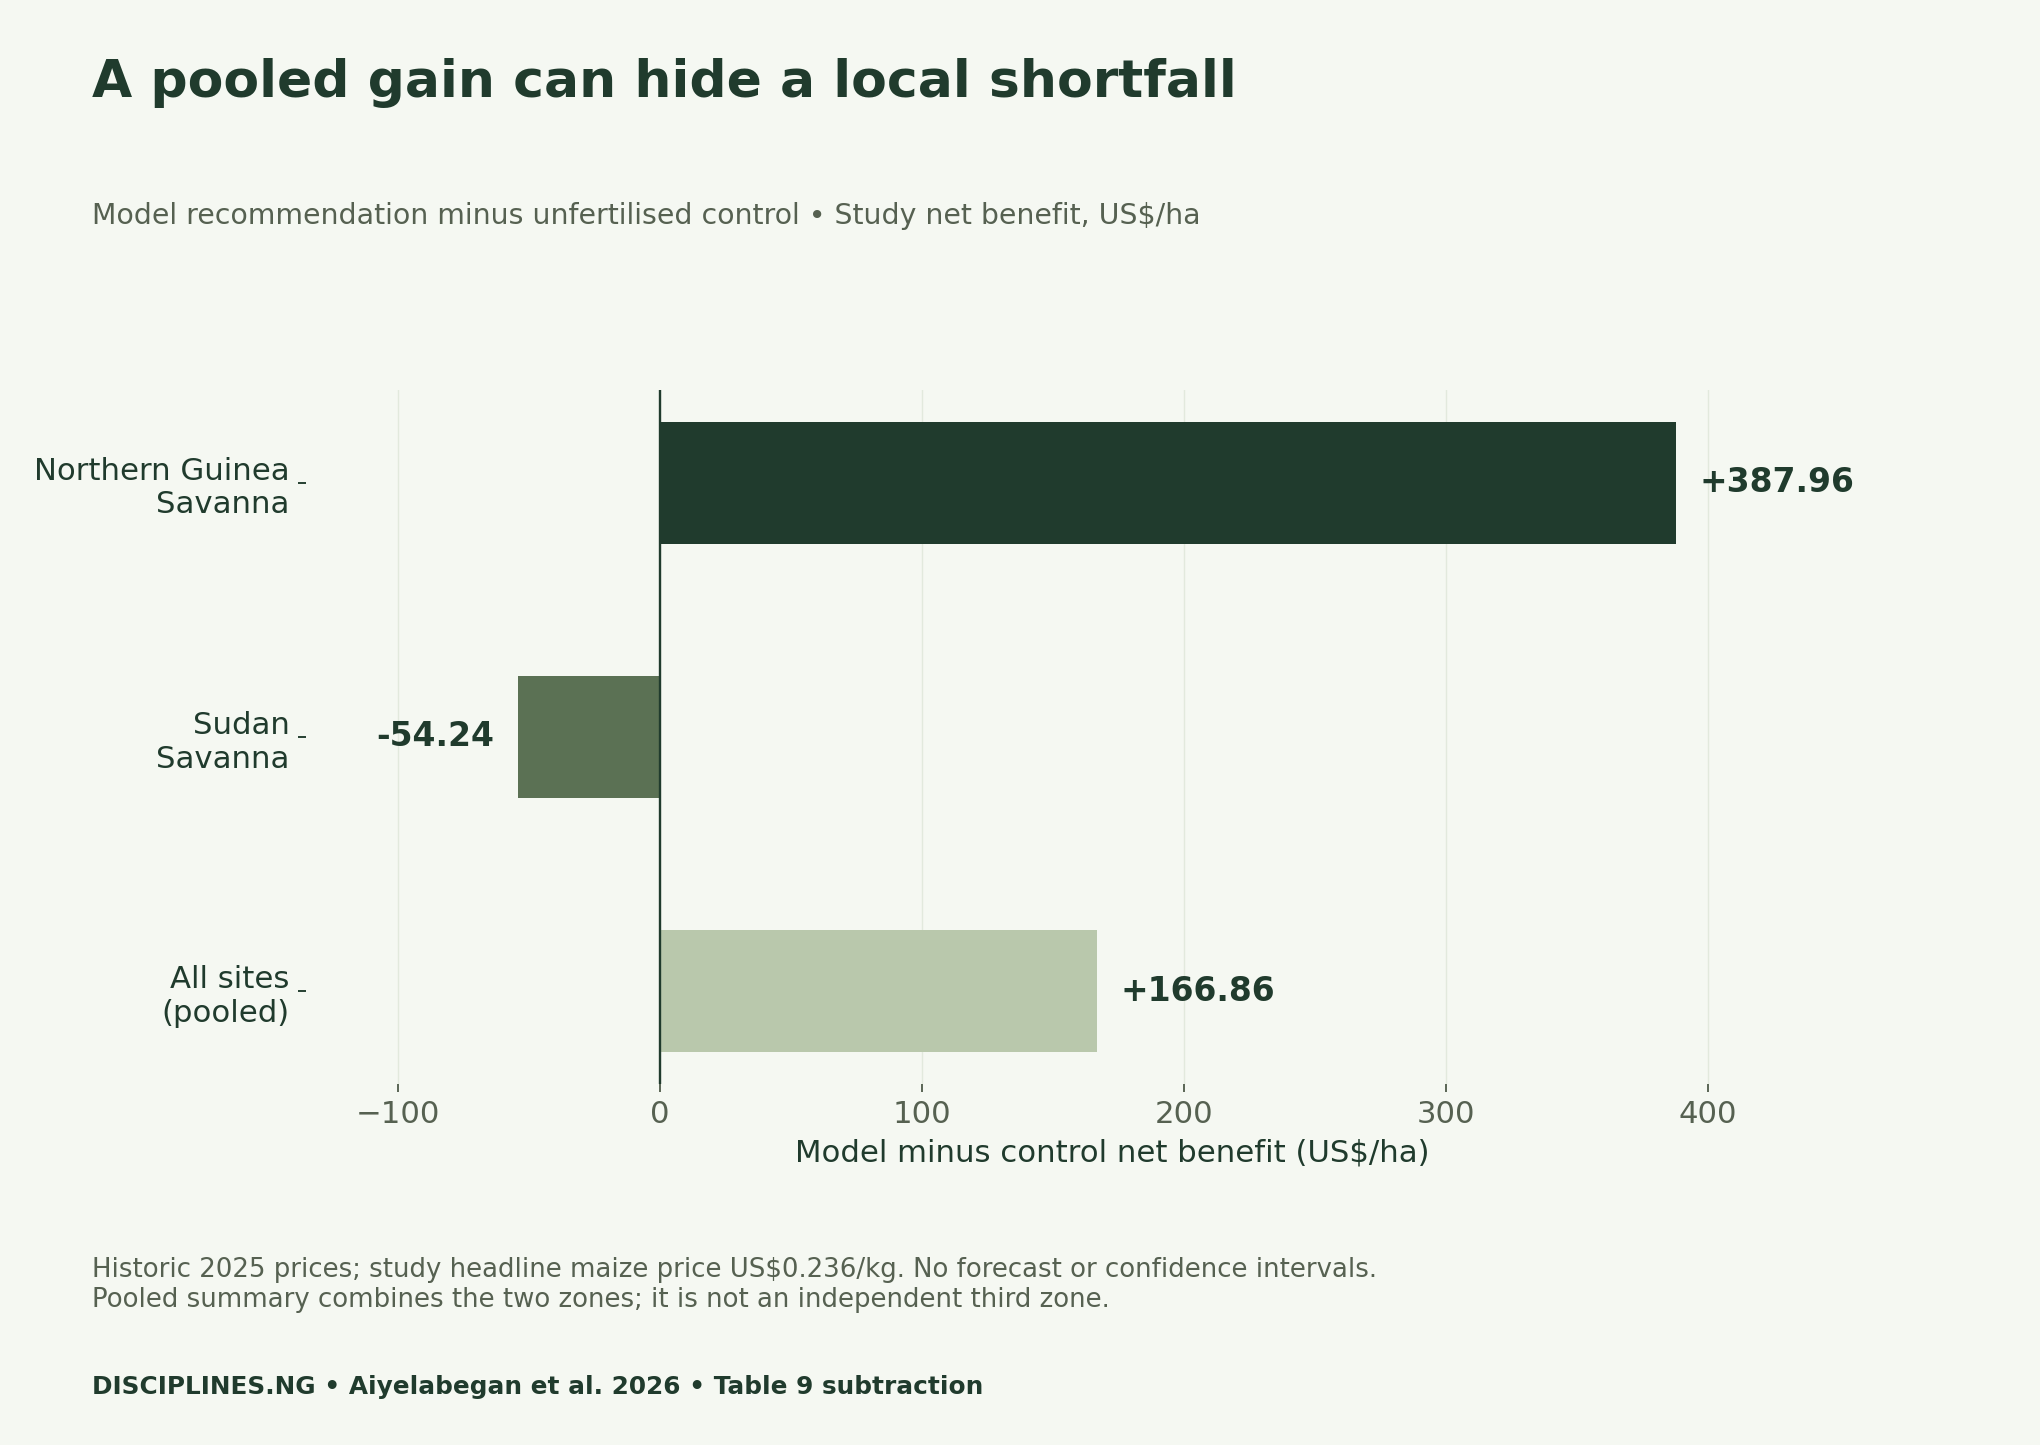
Across all sites, US$640.70 minus US$473.84 gives +US$166.86/ha. The pooled positive difference does not erase the negative Sudan Savanna contrast. Equally, the Sudan result does not prove that fertilizer can never pay there. It describes the strategies, costs, sites and season tested. It supports a local research question rather than a blanket recommendation.
The source table labels its maize price as US$0.236/kg after conversion from the historic naira price. Its displayed yields and dollar inputs also contain rounding. We preserve the published net benefits instead of recomputing the entire table from rounded display values. The contrast CSV subtracts the two reported two-decimal net benefits within each geography.
Check the supplement before quoting price sensitivity
We downloaded and checked Supplementary Table S12. Its scenarios use historic maize prices of ₦220, ₦350 and ₦500/kg, with net benefits in naira per hectare. In its Sudan Savanna rows, the model strategy falls below the control at ₦220 and ₦350/kg. At ₦500/kg, its reported net benefit is ₦327,140 versus ₦306,667 for the control, with a reported marginal rate of return of 6%.
Those figures show sensitivity to the assumed price within the study budget. They are not today’s quotations, a promised selling price or a forecast. Nor is marginal rate of return the same denominator as model-minus-control net benefit. Keep the supplement’s units and comparison definitions intact rather than mixing naira scenarios with dollar bars.
Build a partial-budget bridge for the next trial
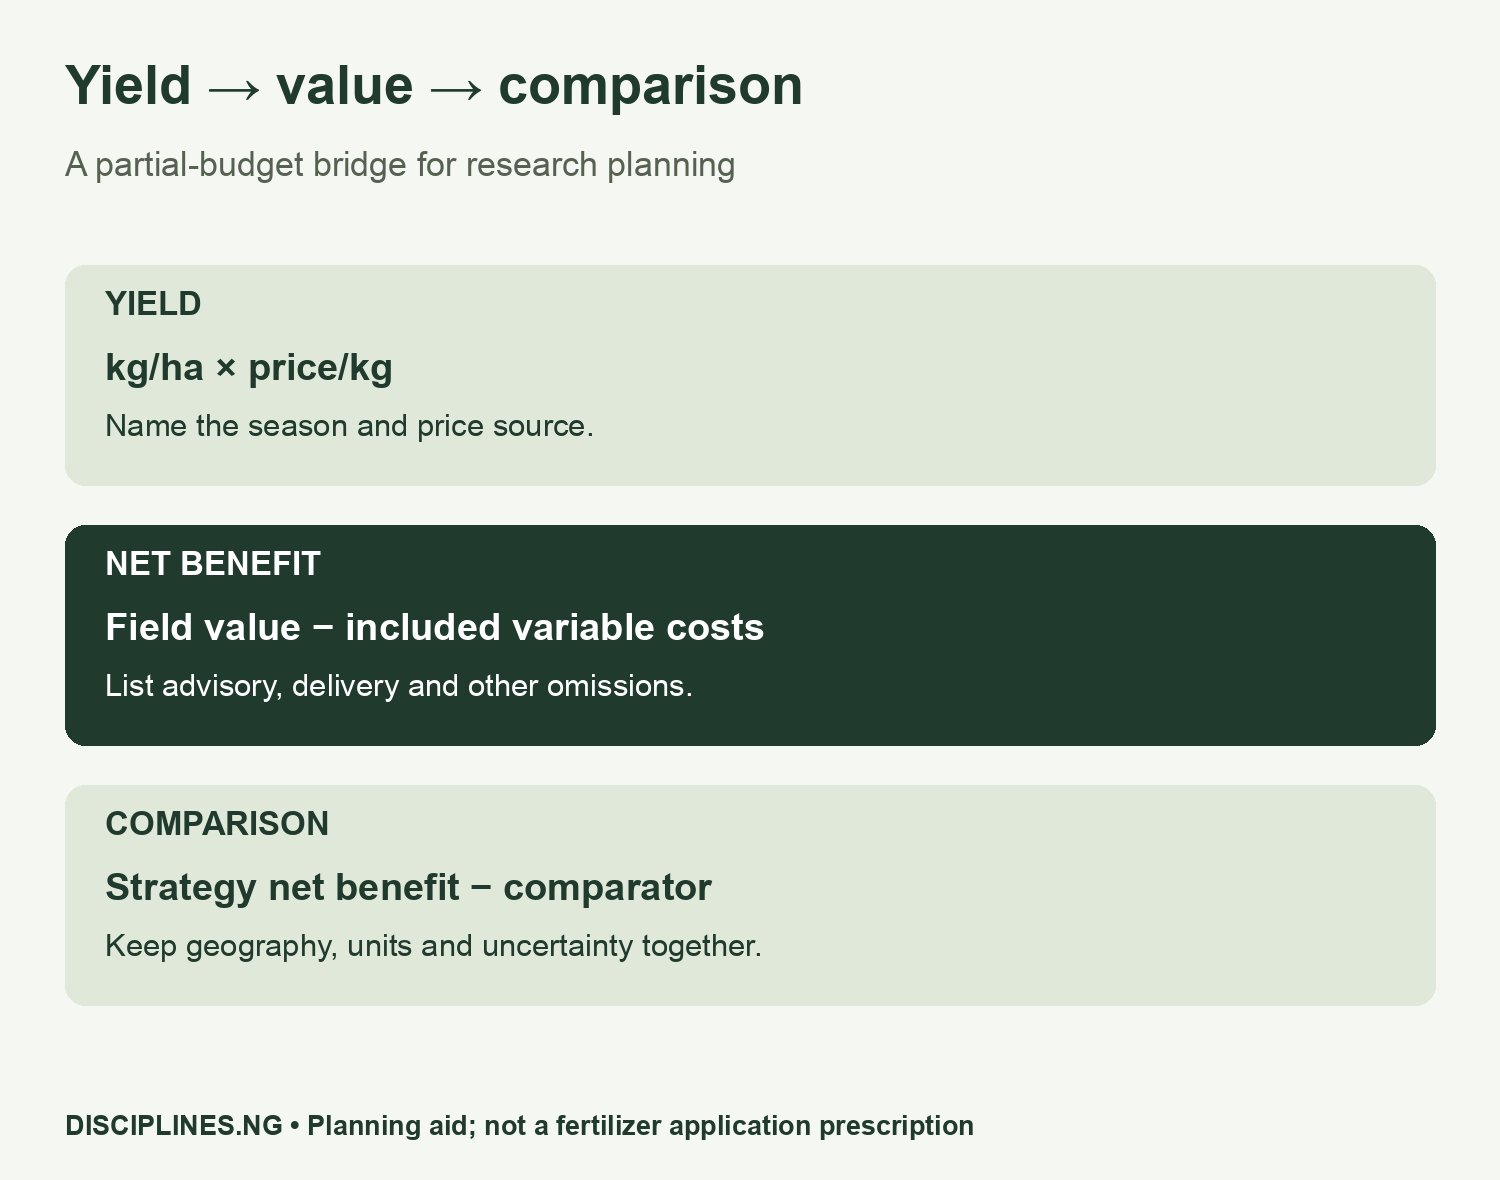
Start with a local question and an explicit comparator. Record grain yield in kg/ha and price in currency/kg, then calculate gross field benefit in currency/ha. Next, list fertilizer, application labour, testing and any additional advisory or delivery costs. Keep a clear note of shared costs that a partial budget excludes.
For each strategy, subtract the included costs from field value, then compare like with like. Do not mix zones, seasons or currencies in one subtraction. Also test plausible price and yield scenarios before designing the follow-up. The blank CSV leaves values empty so an educator or research team can document assumptions without mistaking an example for a farm recommendation.
Limits that matter for local follow-up research
The study used one season and six locations, with three per zone. It excluded ongoing model maintenance, advisory staff time and delivery costs from the reported budget. It did not adjust trial yields downward for farmer-managed conditions. As a result, its net benefits describe a defined comparison rather than total farm profit.
Historical model development and new-season validation answer different questions. The source reports weaker prediction when entire fields or seasons were withheld than under a random split. Training on old plot records therefore cannot replace independent, multi-season field testing. A suitable next study would document local prices, full delivery costs and replication before promoting broad adoption.
Reproduce the analysis and download the planning tools
Our source is the version of record, checked on 21 November 2026. The budget CSV transcribes Table 9 across all four strategies and three geographic summaries. The contrast file computes model minus control from reported net benefits; no participant or plot-level reanalysis is claimed. Table S12 remains linked in its original supplement for sensitivity context.
For related work, see our fertilizer price and exchange-rate analysis, which asks a different question about price drivers. Browse Agriculture and Research & Reports for further source-linked methods.
- Table 9 partial-budget data, all strategies (CSV)
- Reproducible model-minus-control contrasts (CSV)
- Blank local partial-budget worksheet (CSV)
- Measures, units and interpretation dictionary (CSV)
Source credit: Aiyelabegan LM, Lawan AB and Ayobami MA, 2026, DOI 10.1007/s44378-026-00384-w, licensed CC BY 4.0. Disciplines In Nigeria redrew the figures and added the subtractions and planning aid. Suggested citation: “Maize Fertilizer Partial Budget: Check the Nigerian Savanna Zone”, 21 November 2026.


