







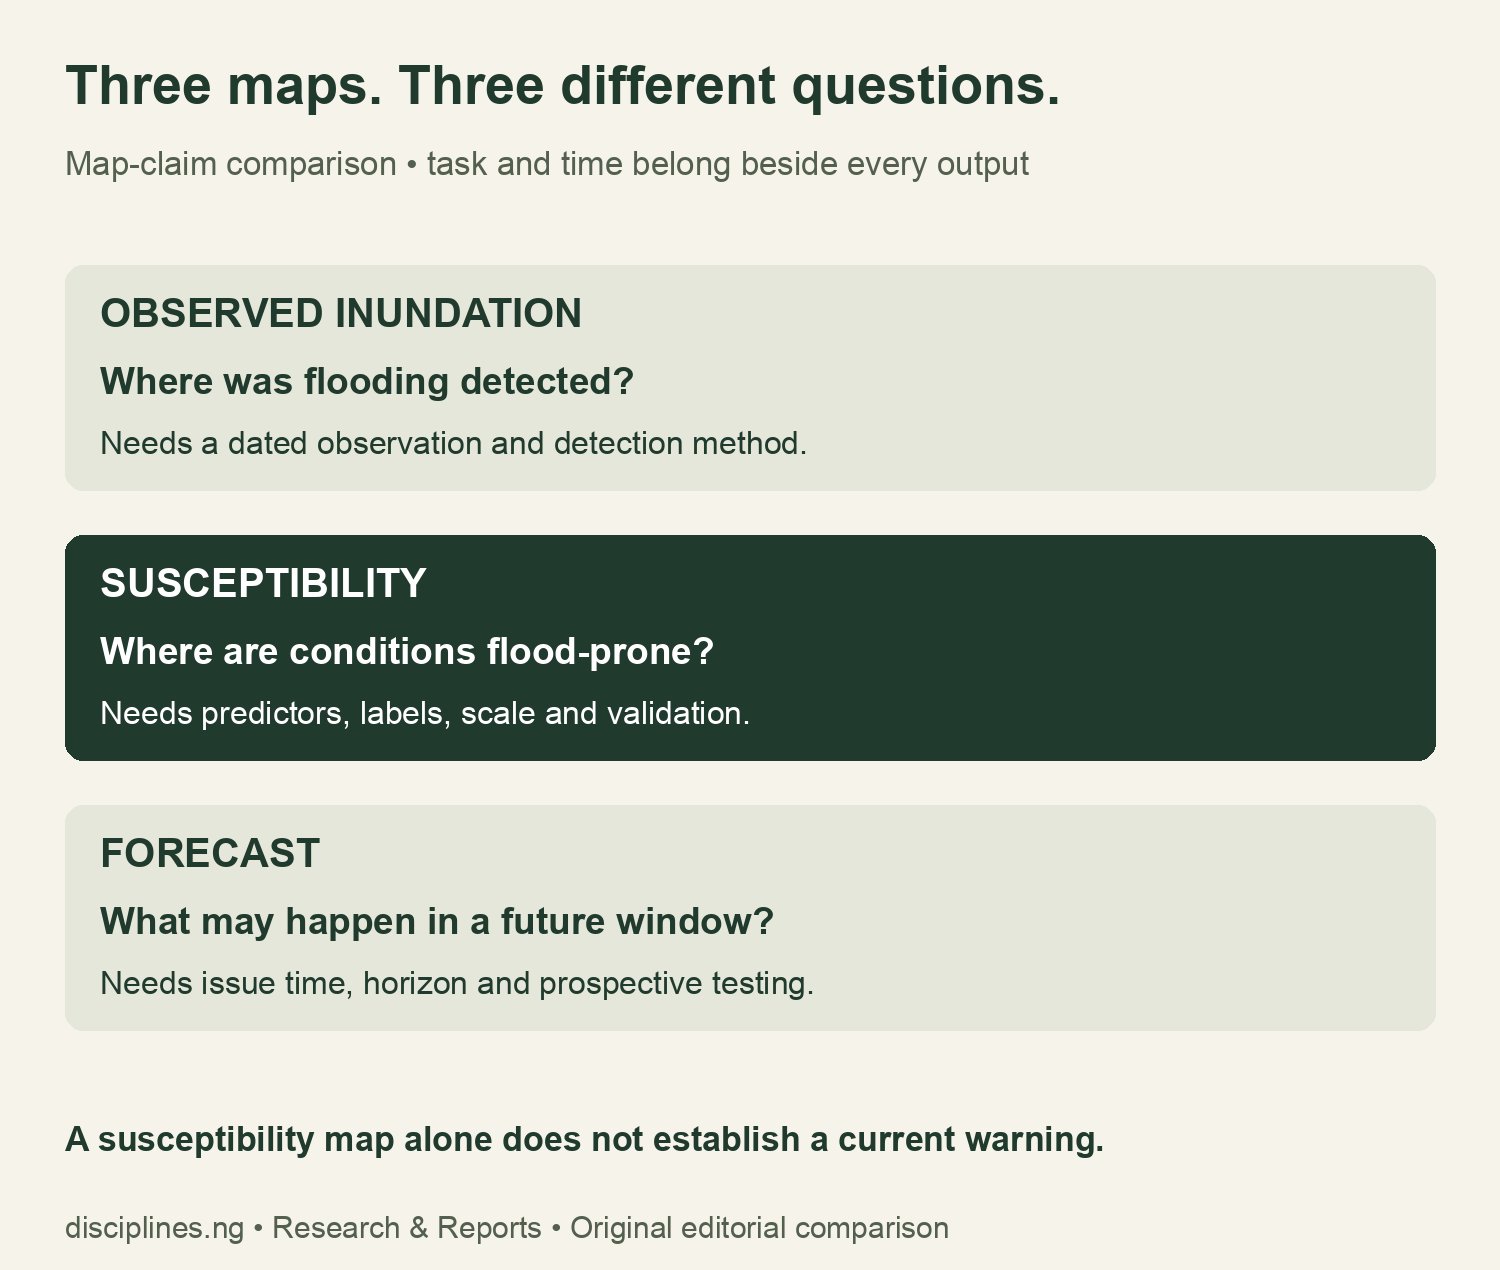
Flood susceptibility mapping Nigeria validation should begin with the map’s task. Is it showing a dated observation, a general pattern of flood-prone conditions or a forecast for a future window? Those questions require different evidence. A new Bayelsa paper gives Nigerian GIS students a local case for practising that distinction.
This report recovers the full publisher methods, records unresolved validation questions and supplies a classroom confusion-matrix calculator. Two original charts demonstrate why one accuracy figure cannot reveal the missed-flood rate. The worked examples are hypothetical. We have not replicated the model, reproduced its maps or assessed any property’s safety. Research checked on 9 November 2026.
Read the Bayelsa paper’s task and dates together
The Geoscience Letters study published on 5 November 2026 reports RF accuracy of 91%. Its methods describe general spatial susceptibility, with Sentinel-1 observations supplying flood/non-flood labels. Rainfall inputs cover January–December 2022, while Figure 13 labels predictions for 2025. These descriptions do not establish a current November 2026 warning.
For a dissertation, write a one-sentence task statement before quoting performance. Name the output, area, reference period and unit of analysis. If the caption and methods use different time language, preserve both in an evidence ledger. Do not resolve an ambiguity by choosing the label that makes a stronger headline.
Flood susceptibility mapping Nigeria validation: what the methods now reveal
We recovered the full paper after the brief’s access problems. It describes a 70/30 training/test partition, training undersampling, repeated five-fold cross-validation and harmonisation to 100-metre rasters. The text also describes threshold selection using test data. We did not establish the actual test-class counts, spatially separated testing or a separate untouched final evaluation set from the inspected reporting.
These are extraction findings, not a claim that an unreported procedure was never performed. Our worksheet distinguishes “stated” from “not established.” It also asks readers to reconcile the algorithm lists across methods and figure captions before producing a detailed model ranking. We do not rank the paper’s algorithms or infer a confusion matrix from its headline.
| Validation question | What to record | Why it matters |
|---|---|---|
| What was labelled? | Sensor, acquisition dates and flood definition | A label is evidence for a particular task and period |
| How was the split made? | Sampling unit, partition rule and spatial/event separation | Nearby or repeated observations may not test transfer |
| Where was tuning done? | Training, validation and final test roles | Selection and final evaluation answer different questions |
| Which errors occurred? | Actual class counts and full confusion matrix | Accuracy alone cannot identify missed floods |
| How does uncertainty transfer? | External location/event checks and calibration | An internal score is not a guarantee elsewhere |
Why 91% accuracy does not determine missed-flood rate
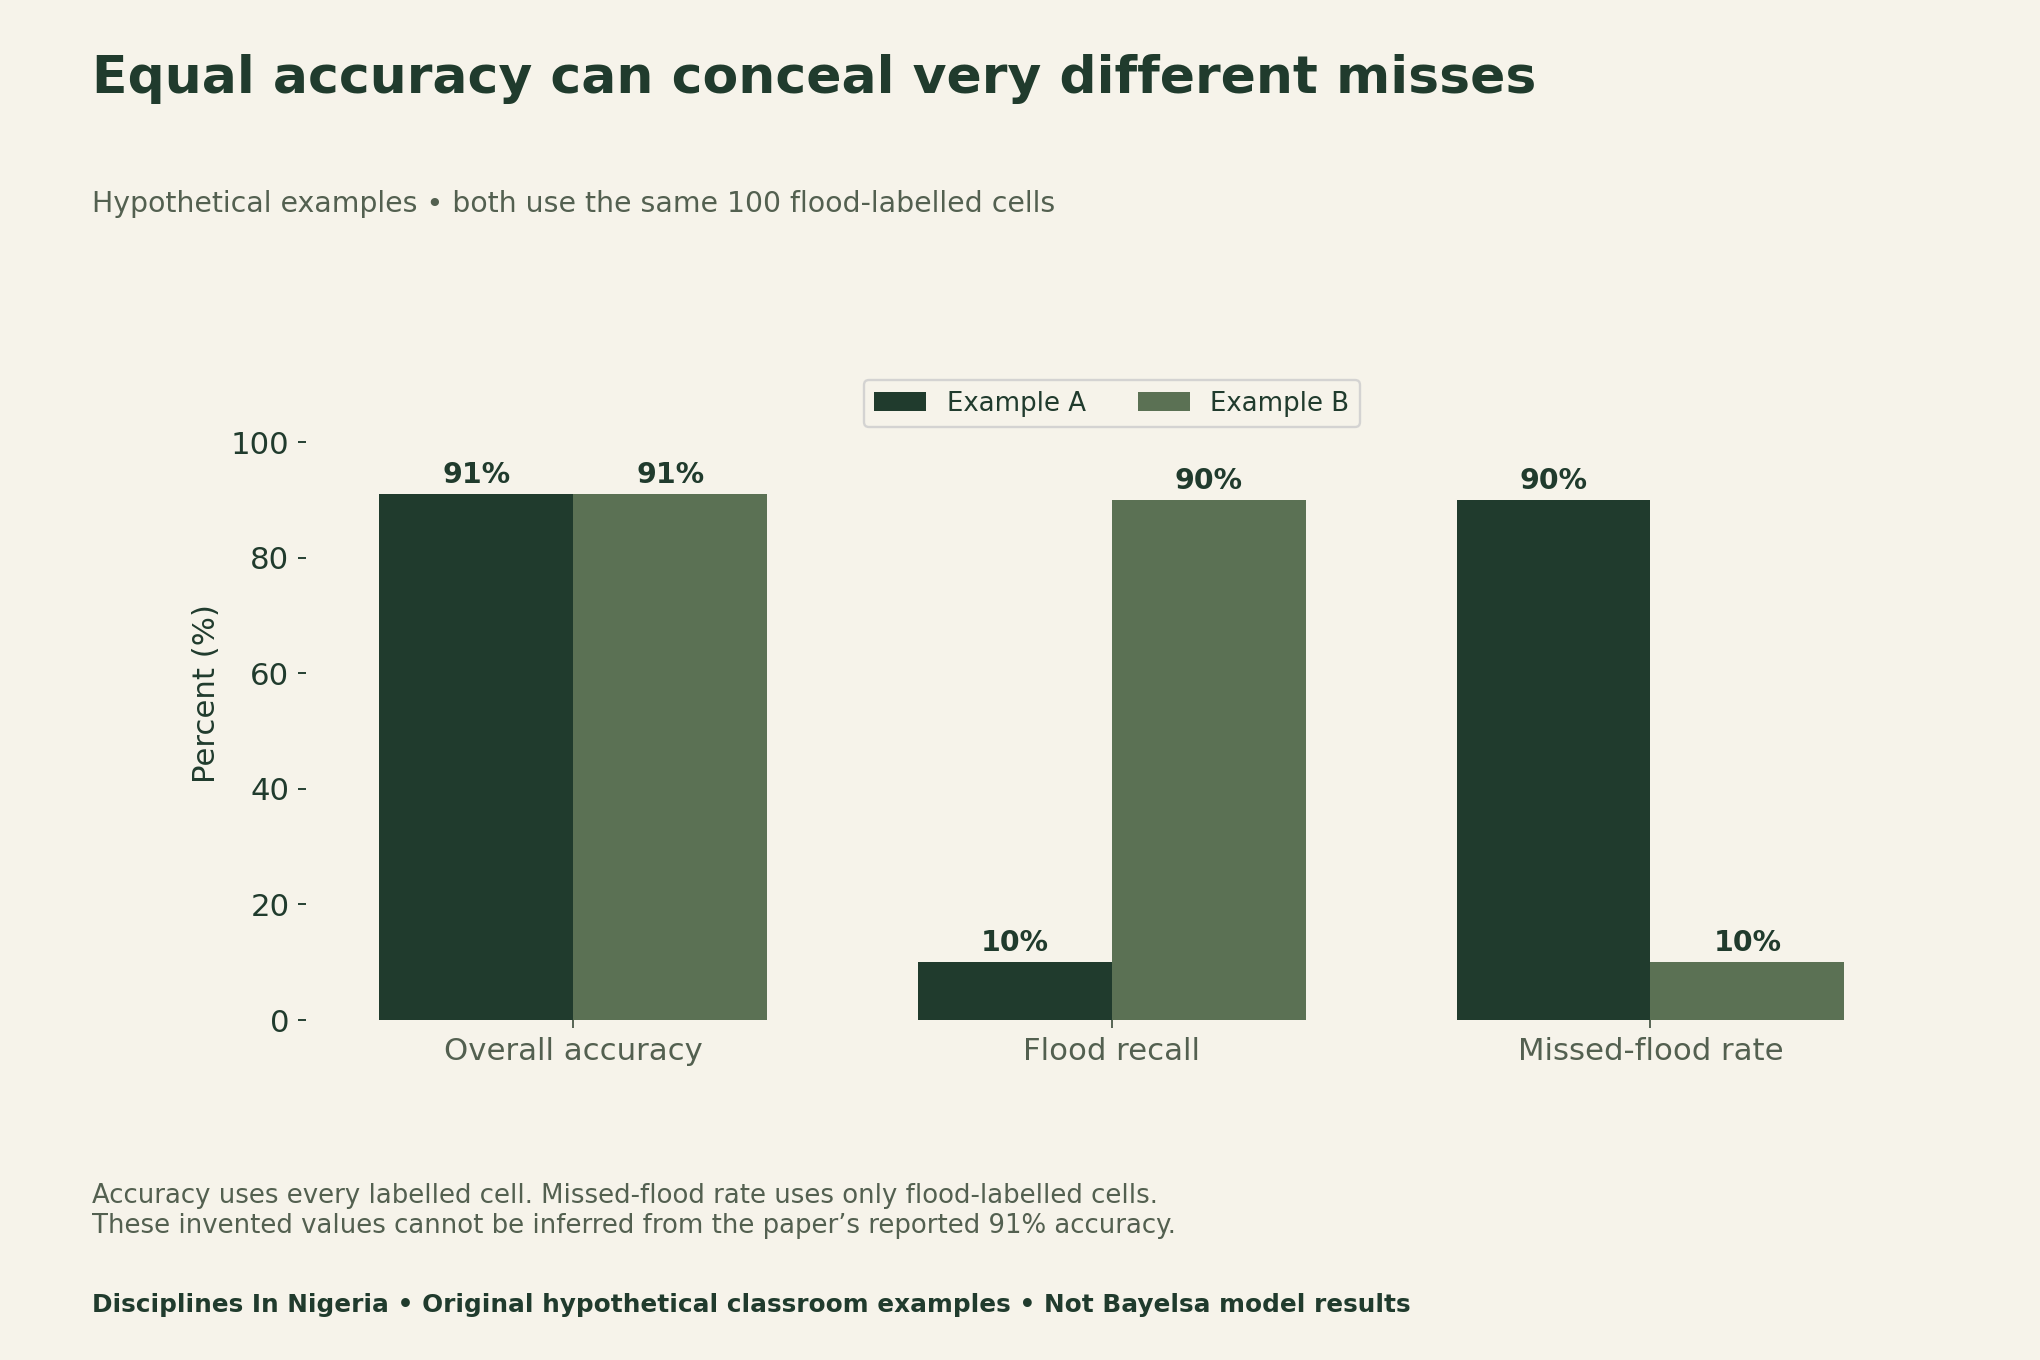
Consider two invented classroom classifiers, each evaluated on 1,000 labelled cells. Both sets contain 100 flood cells and 900 non-flood cells. Each classifier gets 910 cells right, so each has 91% accuracy. Yet they make very different errors within the flood class. These counts are not the Bayelsa paper’s results.
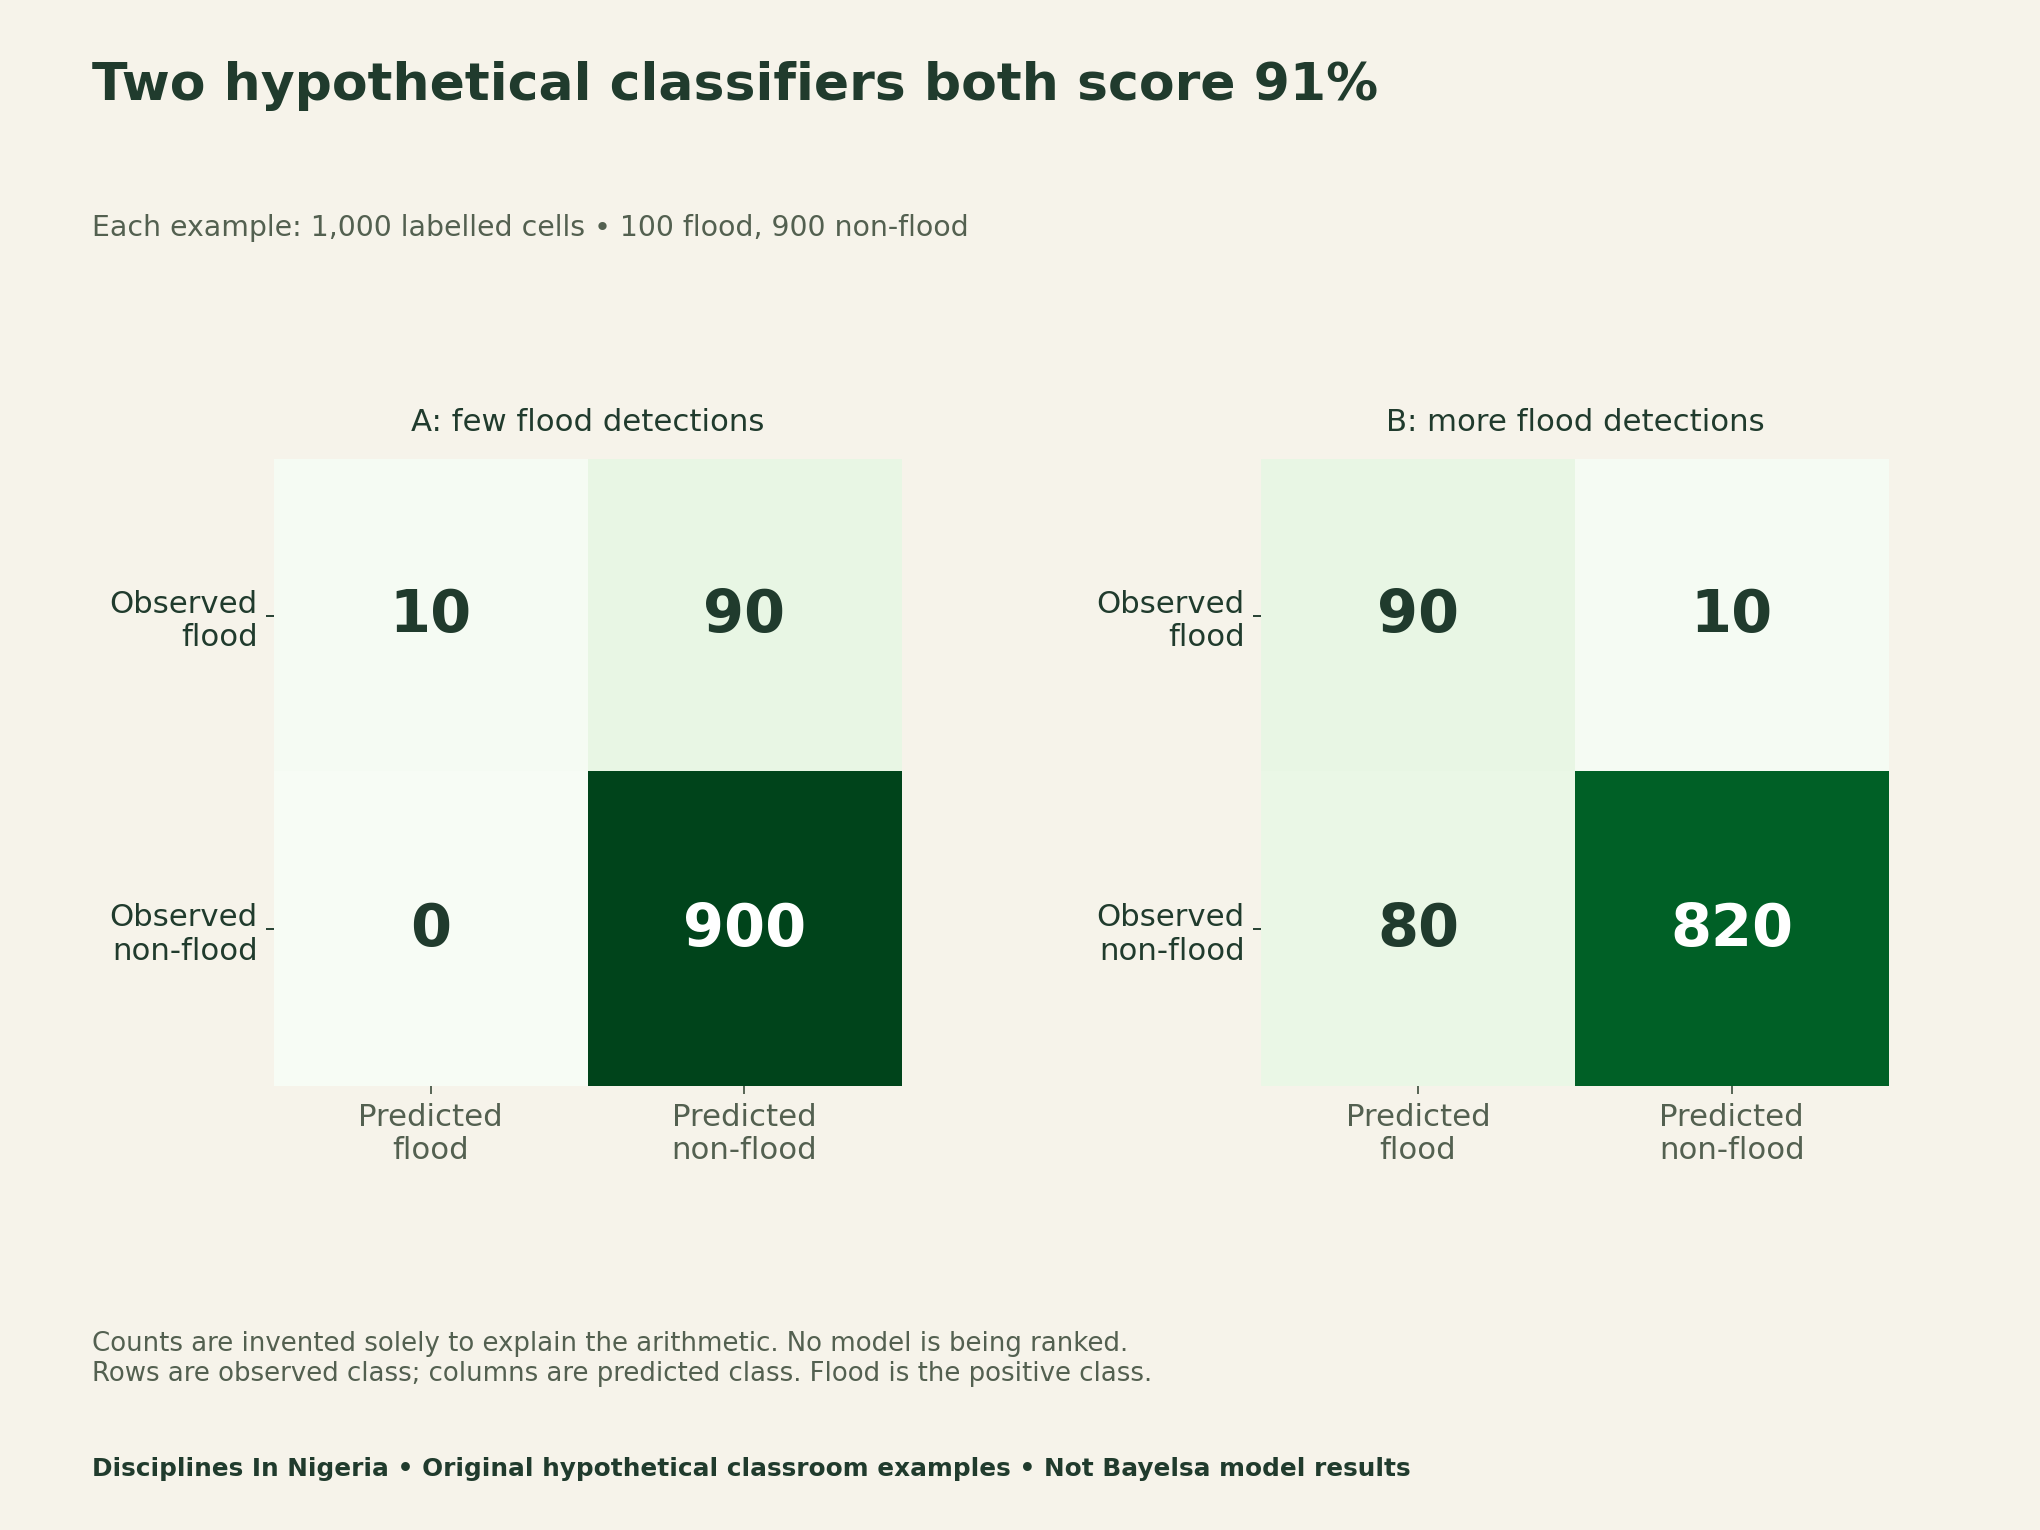
Example A detects 10 of 100 flood-labelled cells and misses 90. Example B detects 90 and misses 10, while giving more false positives among non-flood cells. A higher detection rate therefore does not describe the entire trade-off. Which error matters, and how much, depends on a defined application and evidence beyond this exercise.
The official scikit-learn metric documentation defines confusion-matrix and classification measures. Here flood is the positive class. True positives are correctly detected flood cells; false negatives are flood cells predicted non-flood. False positives are non-flood cells predicted flood, while true negatives are correctly classified non-flood cells.
Use the classroom confusion-matrix calculator
Enter non-negative whole counts. Accuracy equals (true positives + true negatives) divided by all cases. Recall equals true positives divided by observed positives. Missed-flood rate equals false negatives divided by observed positives. Precision uses predicted positives as its denominator. A zero denominator is undefined, not zero performance.
The default inputs reproduce Example A. To reproduce B, enter 90 true positives, 80 false positives, 10 false negatives and 820 true negatives. Keep the hypothetical label if using either example in teaching. Do not attach a real locality to these invented cells or present them as observed flood records.
Separate model selection from a final performance claim
A threshold converts a probability into a class label. Choosing it is a modelling decision. An evaluation used to choose a threshold does not answer exactly the same question as an untouched evaluation after that choice. Record the role of each dataset before describing a score as an independent final check.
Spatial work adds another question: what does the test represent? A random pixel split and a test in an unseen location are different designs. Our audit asks for spatial separation and event dates; it does not assert a measured leakage effect or compute an adjusted accuracy for this paper. Those require data and a specified evaluation design.
Likewise, grid resolution is not positional certainty or a property-level certificate. A 100-metre output cell can summarise conditions at one scale while missing finer features relevant to a particular site. This report offers no evacuation, development-approval or property-safety recommendation from the academic model.
Download a source ledger and two reusable audits
The source ledger separates verified reporting from unresolved details. The hypothetical matrix file reproduces both examples and their metrics. The blank validation sheet supports an evidence-led dissertation audit, while the map-classification table helps prevent a change of task in a headline.
- Bayelsa source and validation ledger (CSV)
- Hypothetical confusion matrices and calculations (CSV)
- Blank flood-model validation extraction sheet (CSV)
- Map-claim classification guide (CSV)
For another Nigerian example of checking scale before making a spatial claim, see our soil-data research guide. Our forest recovery indicator guide also asks whether a measure answers the intended environmental question.
Methods, limitations and citation
For this flood susceptibility mapping Nigeria validation guide, we retained the publisher HTML and 25-page PDF, inspected methods and captions, and recorded source locations. We then constructed two arithmetic examples with equal sample composition and accuracy. No satellite processing, model refit, independent accuracy validation, map reproduction or field assessment was performed.
We use two substantive statistical charts because they directly answer the metric question. Additional terrain-variable bars would not resolve the validation gaps. The infographic supplies the separate non-chart task comparison. Unresolved class counts, time labels, algorithm reconciliation and final evaluation design remain questions for source clarification, not estimates filled by assumption.
Suggested citation: Disciplines In Nigeria (9 November 2026), “Flood Susceptibility Mapping Nigeria: Audit the Validation,” source ledger, classroom calculator and original hypothetical examples. Cite Danhassan and colleagues for their study, and clearly label our examples as invented teaching material.


