







Choosing forest recovery indicators in Nigeria starts with a question: what change would count as recovery? A larger species list can be useful evidence. However, it does not by itself show that a habitat has regained its expected structure or composition. This guide offers an original indicator matrix, an extraction ledger and field-planning tools.
Checked 5 November 2026. A new publication can describe much older field observations. Keep both dates beside any statistic you reuse.
What the Warri River study reports
Ochekwu and Nichodemus published their Discover Plants paper on 3 November 2026. Fieldwork took place in March and July 2021 at three Warri River sites. The study reports 60 quadrats, 144 species, 123 genera and 50 families. Its design compares sites rather than tracking a restoration intervention through time. Read the primary study.
UDF_1 had reported exponential Shannon diversity of 101.46 and inverse Simpson diversity of 94.65; UDF_2's inverse Simpson value was 85.29. These diversity values are effective species numbers, not observed species counts. The growth-form comparison reported p = 0.2096.
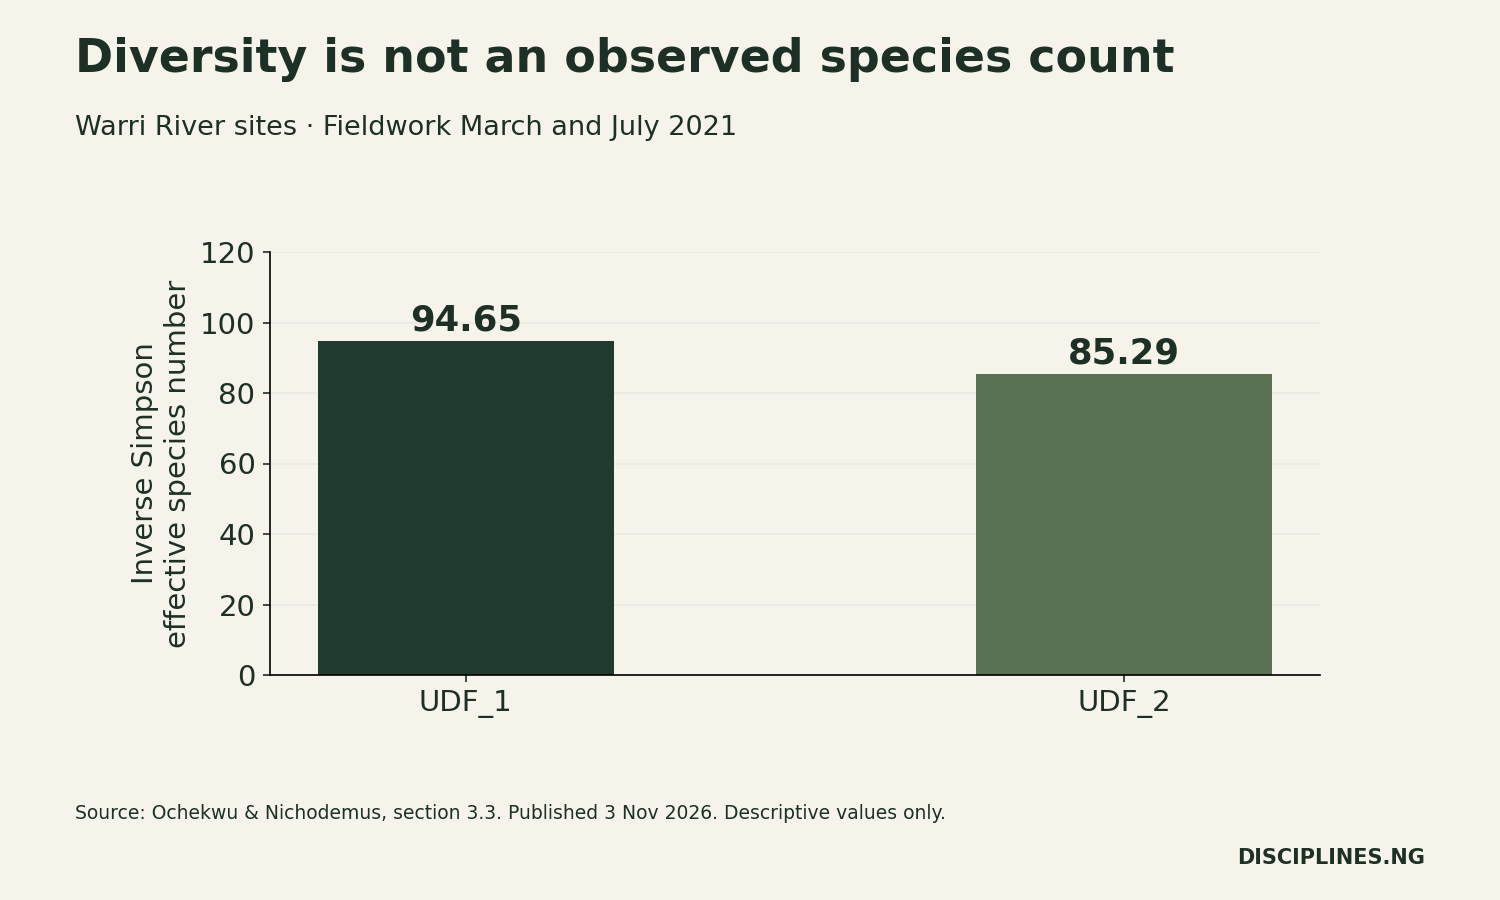
| Measure | UDF_1 | UDF_2 | Interpretation |
|---|---|---|---|
| Inverse Simpson diversity | 94.65 | 85.29 | Effective species number; same metric |
| Exponential Shannon diversity | 101.46 | Not extracted here | Different diversity order; no invented value |
The paper gives disturbed-site richness as 118 in results and 117 in limitations. We exclude that disputed count from a definitive numerical ranking. Aggregated site data and the absence of voucher specimens also limit interpretation. Check sections 3.3 and 4.4 before reusing the results.
Richness answers only one question
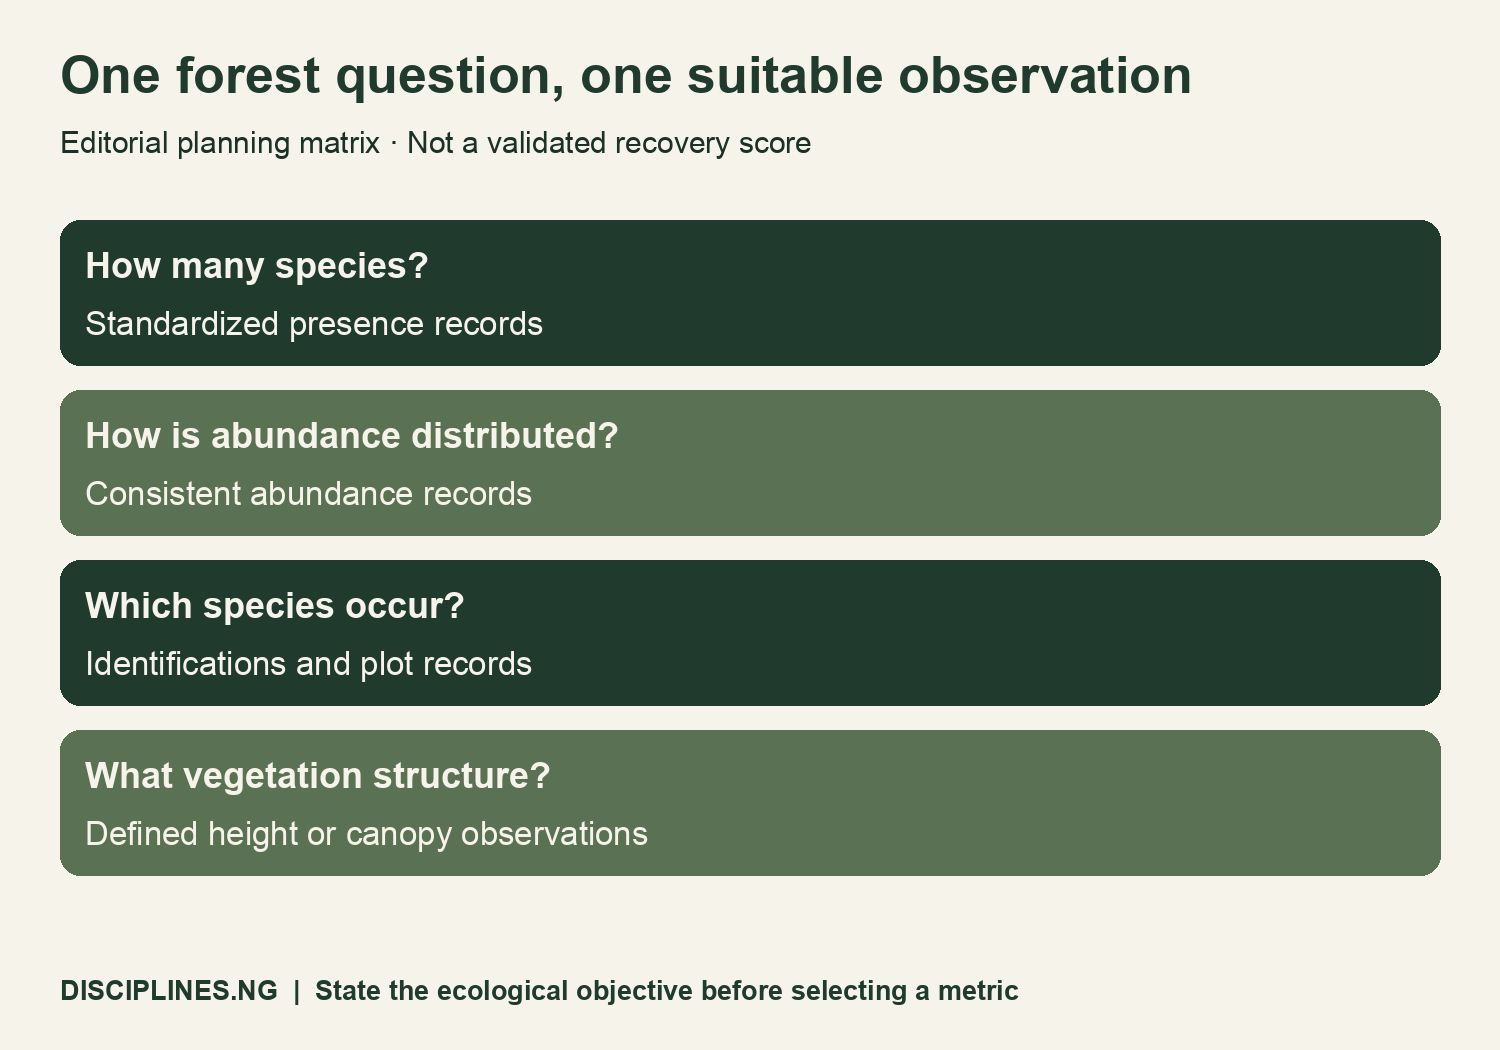
Richness asks how many distinct species were recorded under a sampling method. Evenness concerns the distribution of abundance. Composition asks which species occur. Structure concerns features such as vegetation height or canopy arrangement. Those questions can point in different directions.
For example, imagine two fictional school field plots. One contains many short-lived herbs; the other contains fewer recorded species but a dense tree canopy. The species count alone cannot decide which plot better meets a stated forest objective. The correct interpretation depends on what the project aims to observe.
Do not combine those questions into a single “recovery score” without a justified method. Our matrix is a planning resource, not a validated ecological index. It prompts readers to record a question, its required observations and the inference that would go too far.
Read sampling effort before comparing sites
Section 2.2 describes 20 quadrats per site: ten 20 m × 20 m quadrats for trees and shrubs, and ten 2 m × 2 m quadrats for smaller growth forms. The separate sizes serve different vegetation observations. They should not become a claim that every plant group received identical sampled area.
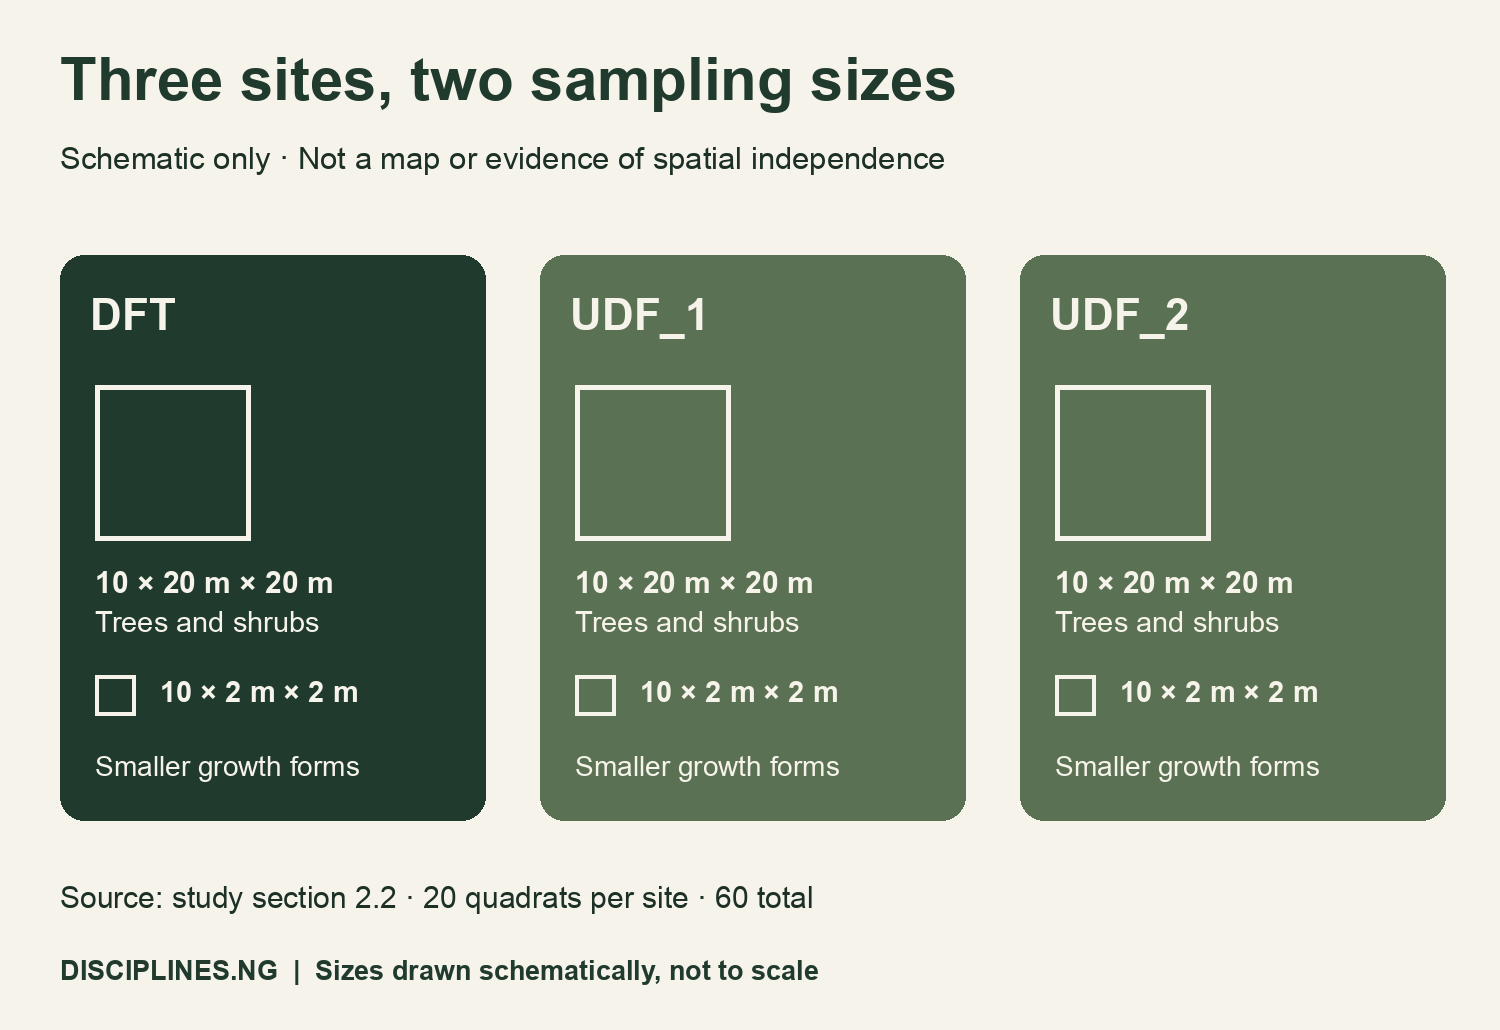
For a student project, record the plot identifier, area, date, observation rule and taxonomic decision. Keep a consistent abundance definition across visits. A change in method can create an apparent difference even when the vegetation has not changed.
Also document what you could not identify. An unresolved taxon should remain unresolved until there is enough evidence to assign it. A neat spreadsheet is less useful than a transparent record of uncertainty.
A non-significant result is not proof of sameness
A p-value does not give the probability that sites are identical. In particular, a non-significant result does not certify ecological equivalence or the absence of disturbance. Ask which hypothesis was tested, how observations entered the test and what uncertainty remains.
Similarly, two descriptive diversity values do not provide a confidence interval for their difference. Our comparison chart therefore contains no significance stars or invented error bars. Readers need the relevant underlying observations and a justified analysis before making stronger inferential claims.
The same caution applies to time. A comparison between locations is not automatically a before-and-after estimate. To claim recovery over time, specify repeated measurements, comparable methods and the period of change. Historical context can motivate that work without replacing it.
Design a useful set of forest recovery indicators
Use this proposed planning sequence when adapting the tools with a supervisor or field-course leader:
- Define the habitat objective and the reference condition.
- Name the intended change and its measurement unit.
- Record the sampling area and observation schedule.
- Retain plot identifiers and species-level observations.
- Predefine how uncertain identifications will be handled.
- List an observation that could contradict your interpretation.
For example, a project concerned with characteristic tree regeneration needs evidence about those trees. A project concerned with plant diversity needs an explicit diversity measure and consistent effort. Avoid allowing whichever metric rises most to become the objective after collection.
Field access, identification procedures and specimen collection need appropriate local arrangements. These worksheets do not grant access or collection permission. Plan any future work through the responsible institution and relevant site authorities.
Download the extraction ledger and planning tools
Source extraction ledger, including the unresolved richness discrepancy (CSV)
Indicator-selection matrix (CSV)
Blank field-project protocol (CSV)
Blank plot observation sheet (CSV)
The ledger identifies the source section, unit, date and chart eligibility of each extracted value. The observation sheet contains no field findings. Keep blank cells blank until observations exist; do not interpret them as zeros.
For replication, obtain species-level abundance data and plot identifiers before recalculating diversity. Our files do not recreate the authors' raw dataset. Cite the original paper for its findings and Disciplines In Nigeria for these independently designed teaching resources.
Methods, limitations and next steps
We checked the primary paper's methods, results and limitations, retained the conflicting richness statements, and charted only the selected verified diversity values. No publisher figure, table layout or photograph was reproduced. This article provides interpretation and planning tools rather than a new ecological survey.
The results concern three historical study sites. They do not establish national forest conditions, carbon-credit performance or a restoration product's effectiveness. Readers planning related environmental work can use our soil-data scale and coverage guide and research-readiness checklist.
The strongest use of forest recovery indicators in Nigeria is to make the next observation more informative. State the desired change first, preserve the measurement method, and explain what would change your conclusion.


