






ICT research in Nigerian universities can show a strong relationship without proving that buying software improves output. Before citing a large correlation, ask what the researchers measured and which claim you want to support. This guide turns one recent paper into an evidence-checking exercise, with original charts and four reusable CSV tools.
Evidence checked: 5 November 2026. The paper was published on 30 October. Its publication date does not establish when respondents completed the survey.
What the new university study measures
Onwughai and colleagues surveyed 700 respondents across eight private universities in North-Central Nigeria: 500 students and 200 academic staff. The stated population covered 32 universities. Their cross-sectional questionnaire contained 15 items with four response options. Read the study and its publication record.
Table 1 reports correlations of 0.865 for research activities, 0.830 for assessment practices and 0.848 for administrative decision-making. Corresponding reported R² values are 0.747, 0.689 and 0.719. These are relationships between questionnaire measures, not measured gains after an intervention. Check the original methods and Table 1.
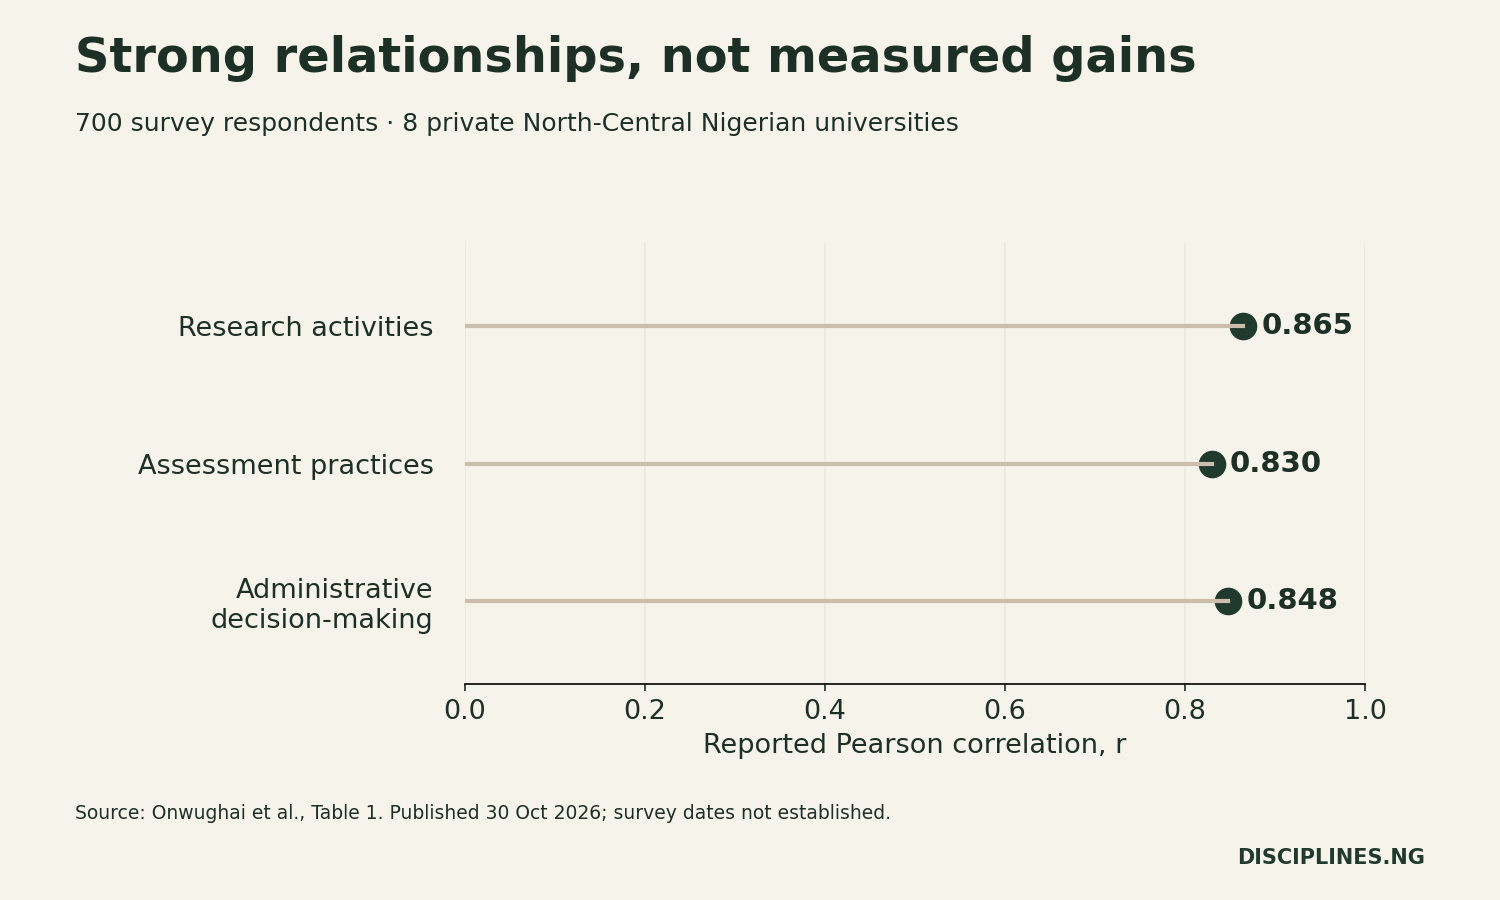
| Outcome | Reported r | Reported R² |
|---|---|---|
| Research activities | 0.865 | 0.747 |
| Assessment practices | 0.830 | 0.689 |
| Administrative decision-making | 0.848 | 0.719 |
The authors identify possible common-method bias and limitations from institutional coverage and single-predictor models. The design cannot establish causation. Fieldwork dates were not established for this article.
Correlation, explained variation and improvement differ
Correlation describes how two measured variables move together in a sample. Its sign gives direction; its magnitude describes the strength of a linear relationship. A value of 0.865 does not mean that respondents produced 86.5% more research.
By contrast, R² describes variation accounted for by the fitted model. It does not divide an outcome into a technology-caused share and an unrelated share. Converting 0.747 to 74.7% changes the display, not the design's ability to establish cause.
Finally, a percentage improvement requires an outcome, a baseline and a comparison. You might compare the time needed to process similar requests before and after a change. Even then, staffing, workload and other changes could explain the difference.
Keep those quantities separate in your notes. Our data file preserves the paper's reported R² values rather than replacing them with squared, rounded correlations. Small rounding differences should not become an unannounced correction.
Match the sentence to the evidence
A defensible sentence names the measure, participants and design. For example: “The survey found a positive association between reported ICT use and reported research activities in the participating private universities.” Cite the original study beside that sentence.
An unsupported sentence would claim that a named software product increased university productivity by 86.5%. That wording changes an association into an intervention effect, adds a product comparison and invents an output measure.
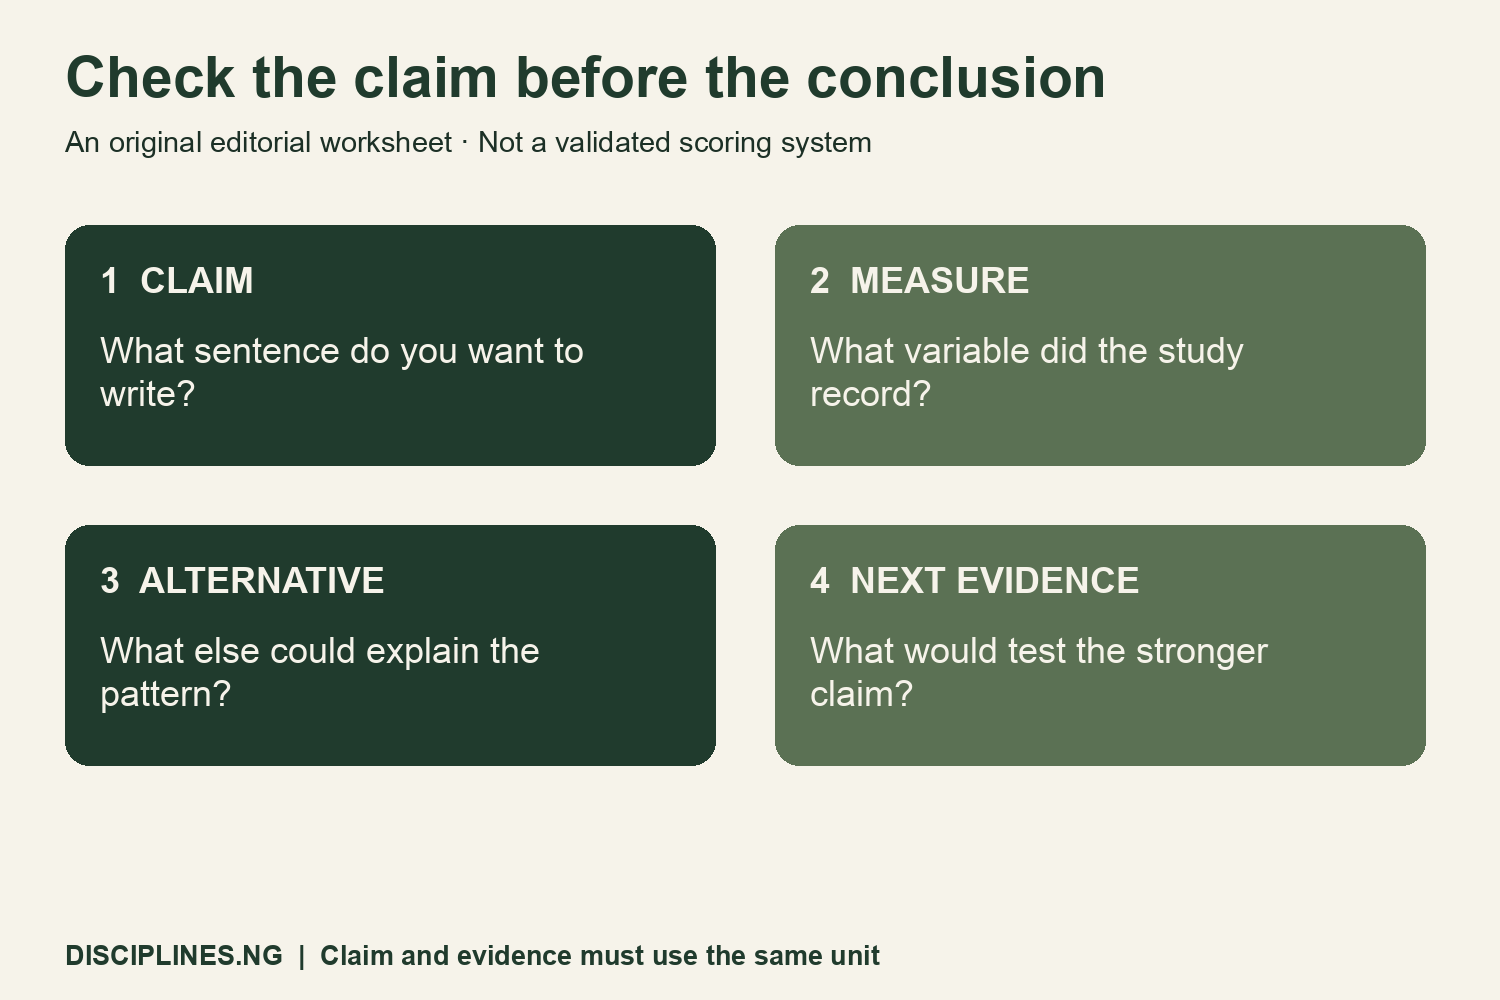
Before accepting any technology-benefit claim, complete four checks:
- Write the proposed claim in one plain sentence.
- Name the variable actually recorded, including its unit.
- List at least one plausible alternative explanation.
- Identify the extra observation needed to test the stronger claim.
For a dissertation, this process helps keep the literature review aligned with your research question. For a procurement discussion, it helps specify what evidence a pilot must collect. Neither use requires dismissing the survey; each requires keeping its contribution within its design.
An evidence ladder for campus decisions
Different questions call for different records. A perception survey can ask whether users find a service helpful. A service log can show when requests arrive and leave a queue. A planned evaluation can compare changes under an explicitly chosen design.
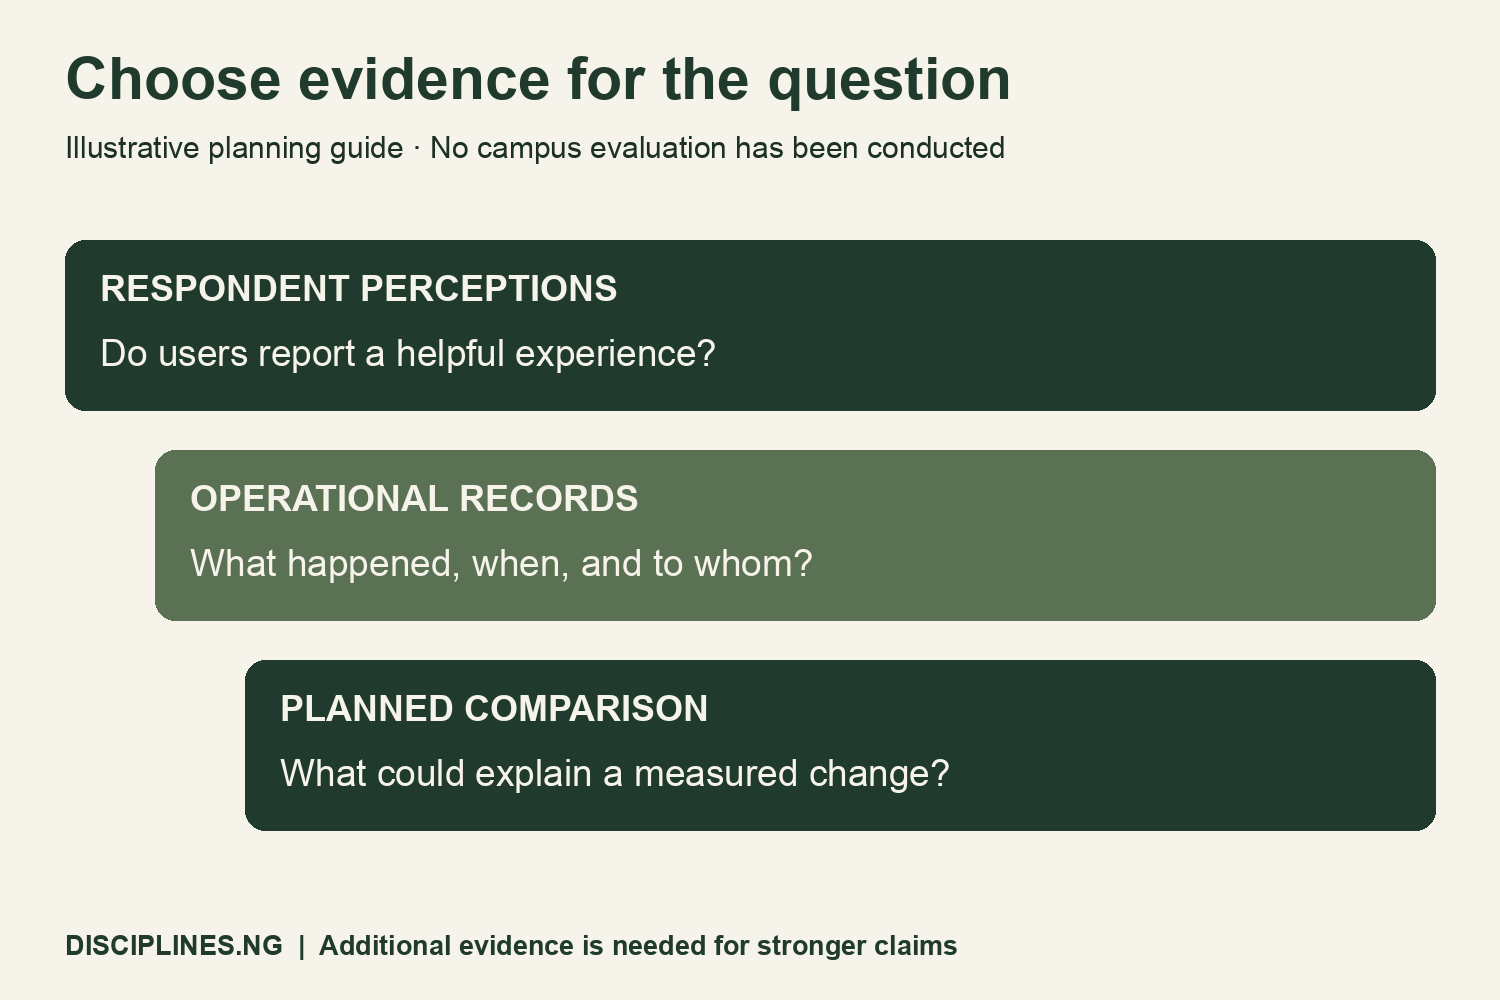
Use the illustration as a planning aid rather than a universal ranking of research quality. A detailed interview may be the best way to discover an access problem. A timestamp may be the best way to measure a delay. The intended question determines the useful evidence.
Suppose a campus wants to test a new request portal. First define turnaround time: does the clock start at first contact or only after a complete application? Does it stop when staff approve a request or when the student receives the result? Record that definition before collecting data.
Next, identify a comparison that can address the question. Document why services or periods differ. Where a credible comparison is unavailable, report a descriptive change with its limitations. Do not relabel it a causal effect because the direction looks encouraging.
Plan a follow-up before selecting a tool
The evaluation protocol below is an original blank template. It contains no findings and makes no claim that a campus has tested a portal. A supervisor can adapt it to a feasible, approved project.
- Define one service, its eligible requests and a primary outcome.
- Record the baseline period and proposed comparison.
- Log workload, staffing, policy changes and interruptions.
- Set inclusion rules and missing-data handling in advance.
- Agree access controls, consent requirements and retention rules.
- Record implementation failures as well as successful requests.
For example, an unavailable connection may affect whether a request reaches the system at all. Looking only at completed requests could hide that problem. A useful protocol therefore asks what the dataset excludes, as well as what its rows contain.
Avoid putting student identifiers or sensitive case details into the public worksheets. Use approved institutional storage for operational records. The downloadable templates are planning tools, not a request to disclose personal information.
Download the data and teaching tools
Reported correlations and R², with source locations (CSV)
Claim-and-evidence worksheet with an illustrative example (CSV)
Blank campus-service evaluation protocol (CSV)
Measurement dictionary for a proposed evaluation (CSV)
The results CSV contains three published aggregate rows, not respondent-level data. The other files are original editorial resources: one clearly labelled example and blank fields for future work. Keep the source column when reusing the numerical extract. Cite Onwughai and colleagues for the study and Disciplines In Nigeria for these independent teaching tools.
Methods, reuse and limits
We transcribed the published aggregate results and checked them against Table 1. We created the chart and explanatory diagrams independently; no publisher figure or questionnaire was reproduced. The journal page and PDF display different licence statements, so our resources do not rely on permission to adapt the paper's artwork or prose.
This is an appraisal of ICT research in Nigerian universities, not a new survey or a reanalysis of individual responses. We did not estimate product effects, campus costs or national outcomes. Readers seeking a research setting can also use our Nigerian university research-readiness checklist and guide to evaluating a small programme study.
The practical next step is to write a claim that your evidence can answer. If the claim concerns experience, measure experience. If it concerns a change in service performance, define the performance measure and comparison before interpreting the result.


