





For seasonal fish contamination sampling design in Nigeria, start by defining what counts as an independent specimen. Four markets, two species and twelve months make 96 design cells. Adding seven analytes makes 672 possible cell–analyte combinations. Neither calculation establishes how many independent fish a study purchased.
The Laoye and colleagues paper published on 12 November 2026 describes monthly hake and herring collection in four Ado Ekiti markets from August 2024 to July 2025. Its methods name seven metals and triplicate laboratory analyses. This guide uses those design dimensions to teach sampling records, without making current market-safety claims.
Seasonal fish contamination sampling design in Nigeria: draw the grid
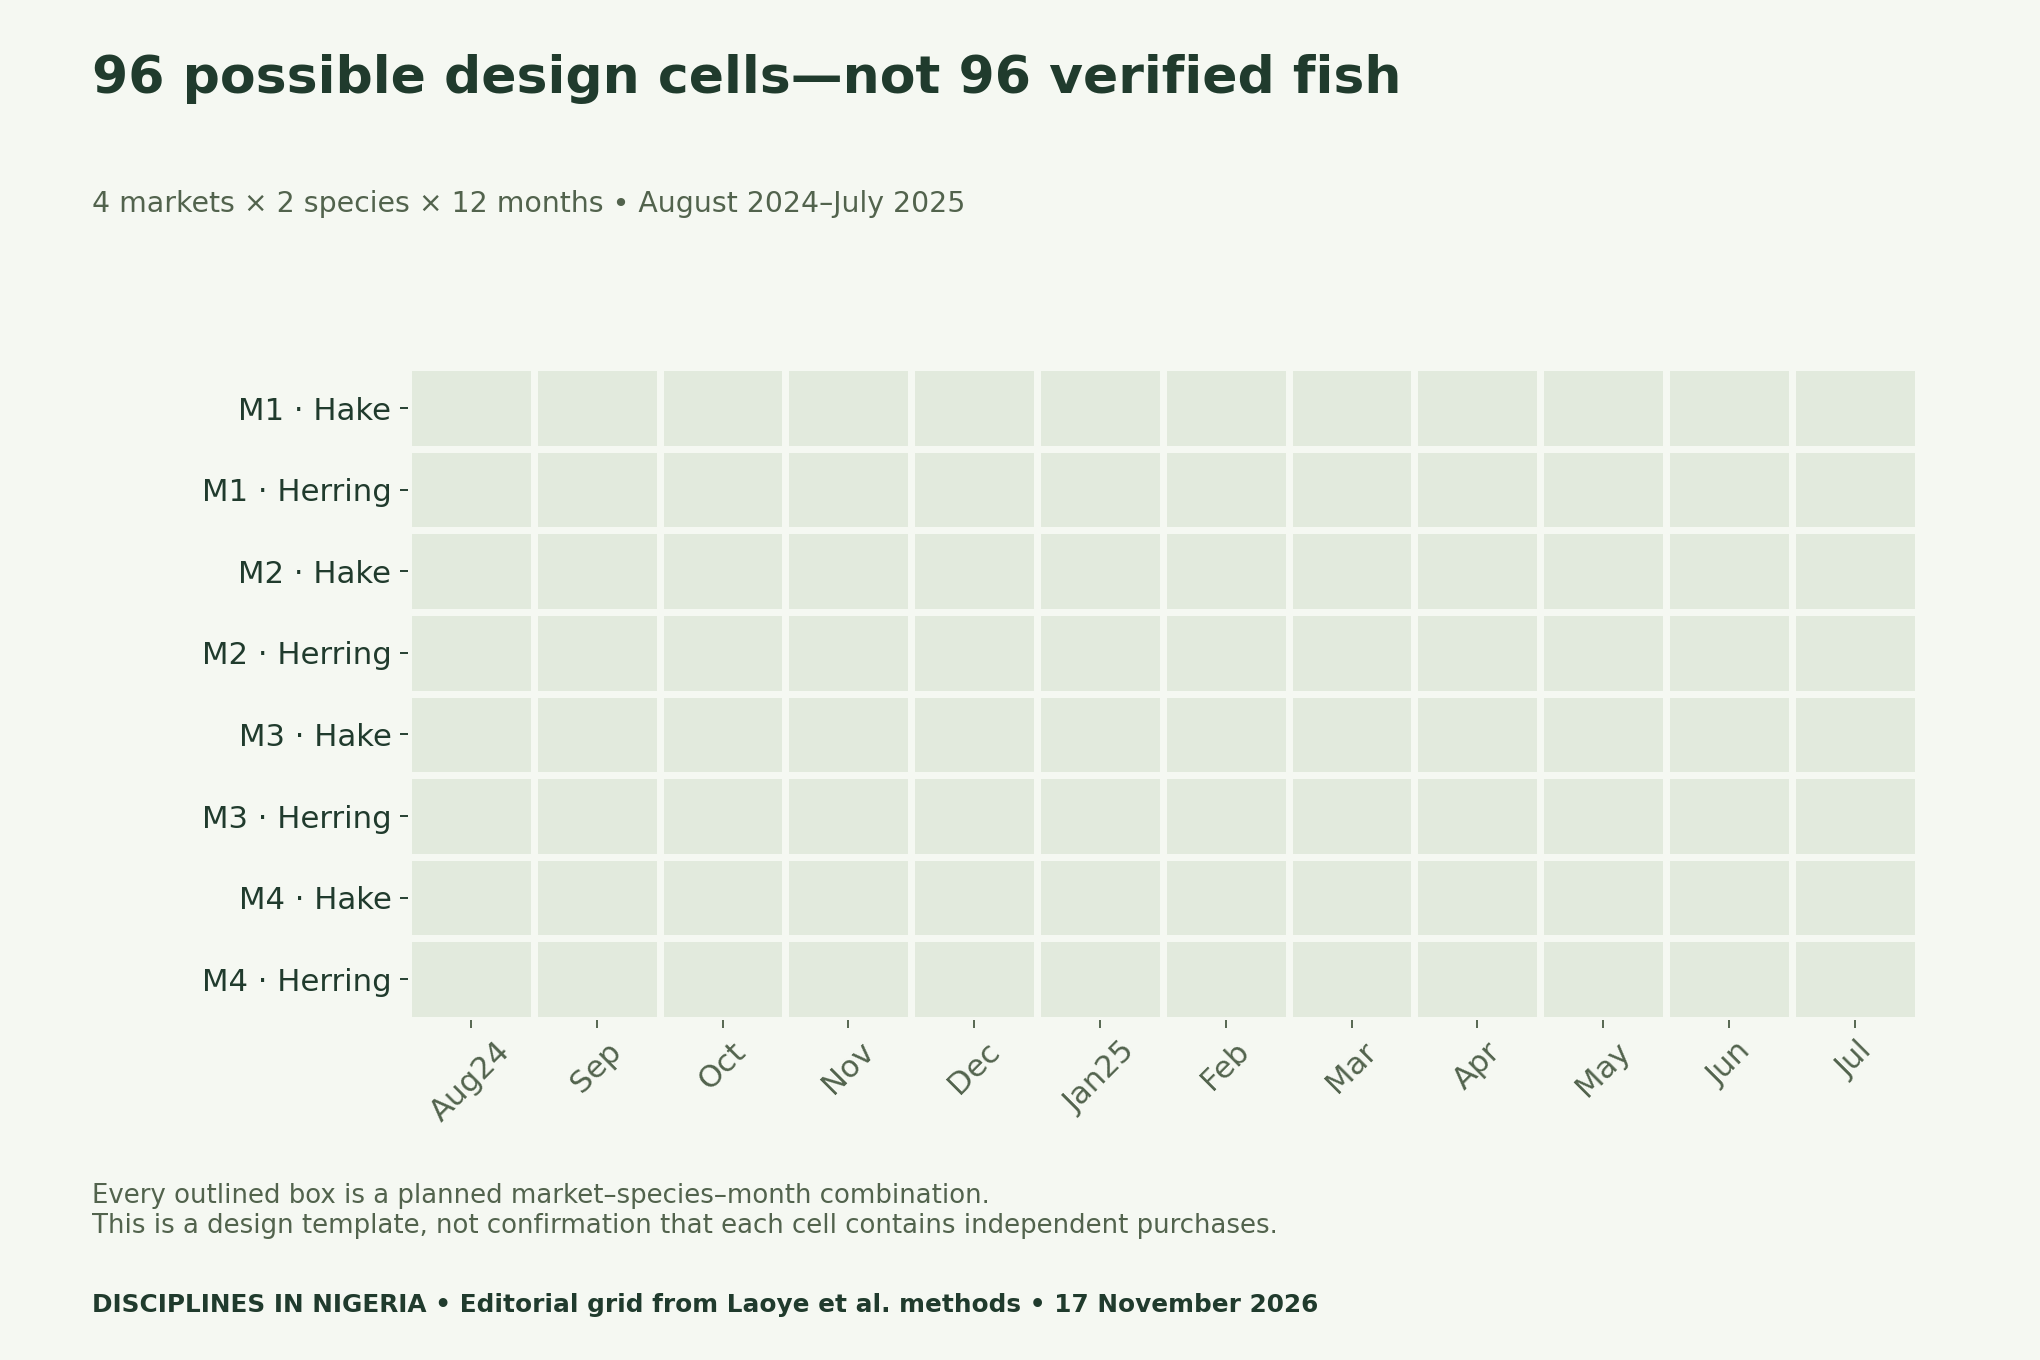
A design cell identifies a combination of factors. Here the factors are market, species and month. A cell might contain one specimen, several separate purchases, a pooled material sample or no usable observation. Only the actual acquisition and preparation records can establish which applies.
Therefore, do not infer a sample size from the dimensions of a table alone. First build the planned grid. Then attach verified acquisition records and mark gaps. The downloadable template leaves specimen counts blank because this review did not establish a complete independent-purchase ledger.
The same care applies to analytes. Seven measurements of different metals describe different outcomes on material; they do not create seven new fish. A complete factorial grid would allow 96 times seven, or 672, cell–analyte combinations. That remains a conditional design calculation, not a count of verified results.
Separate biological units from analytical repeats
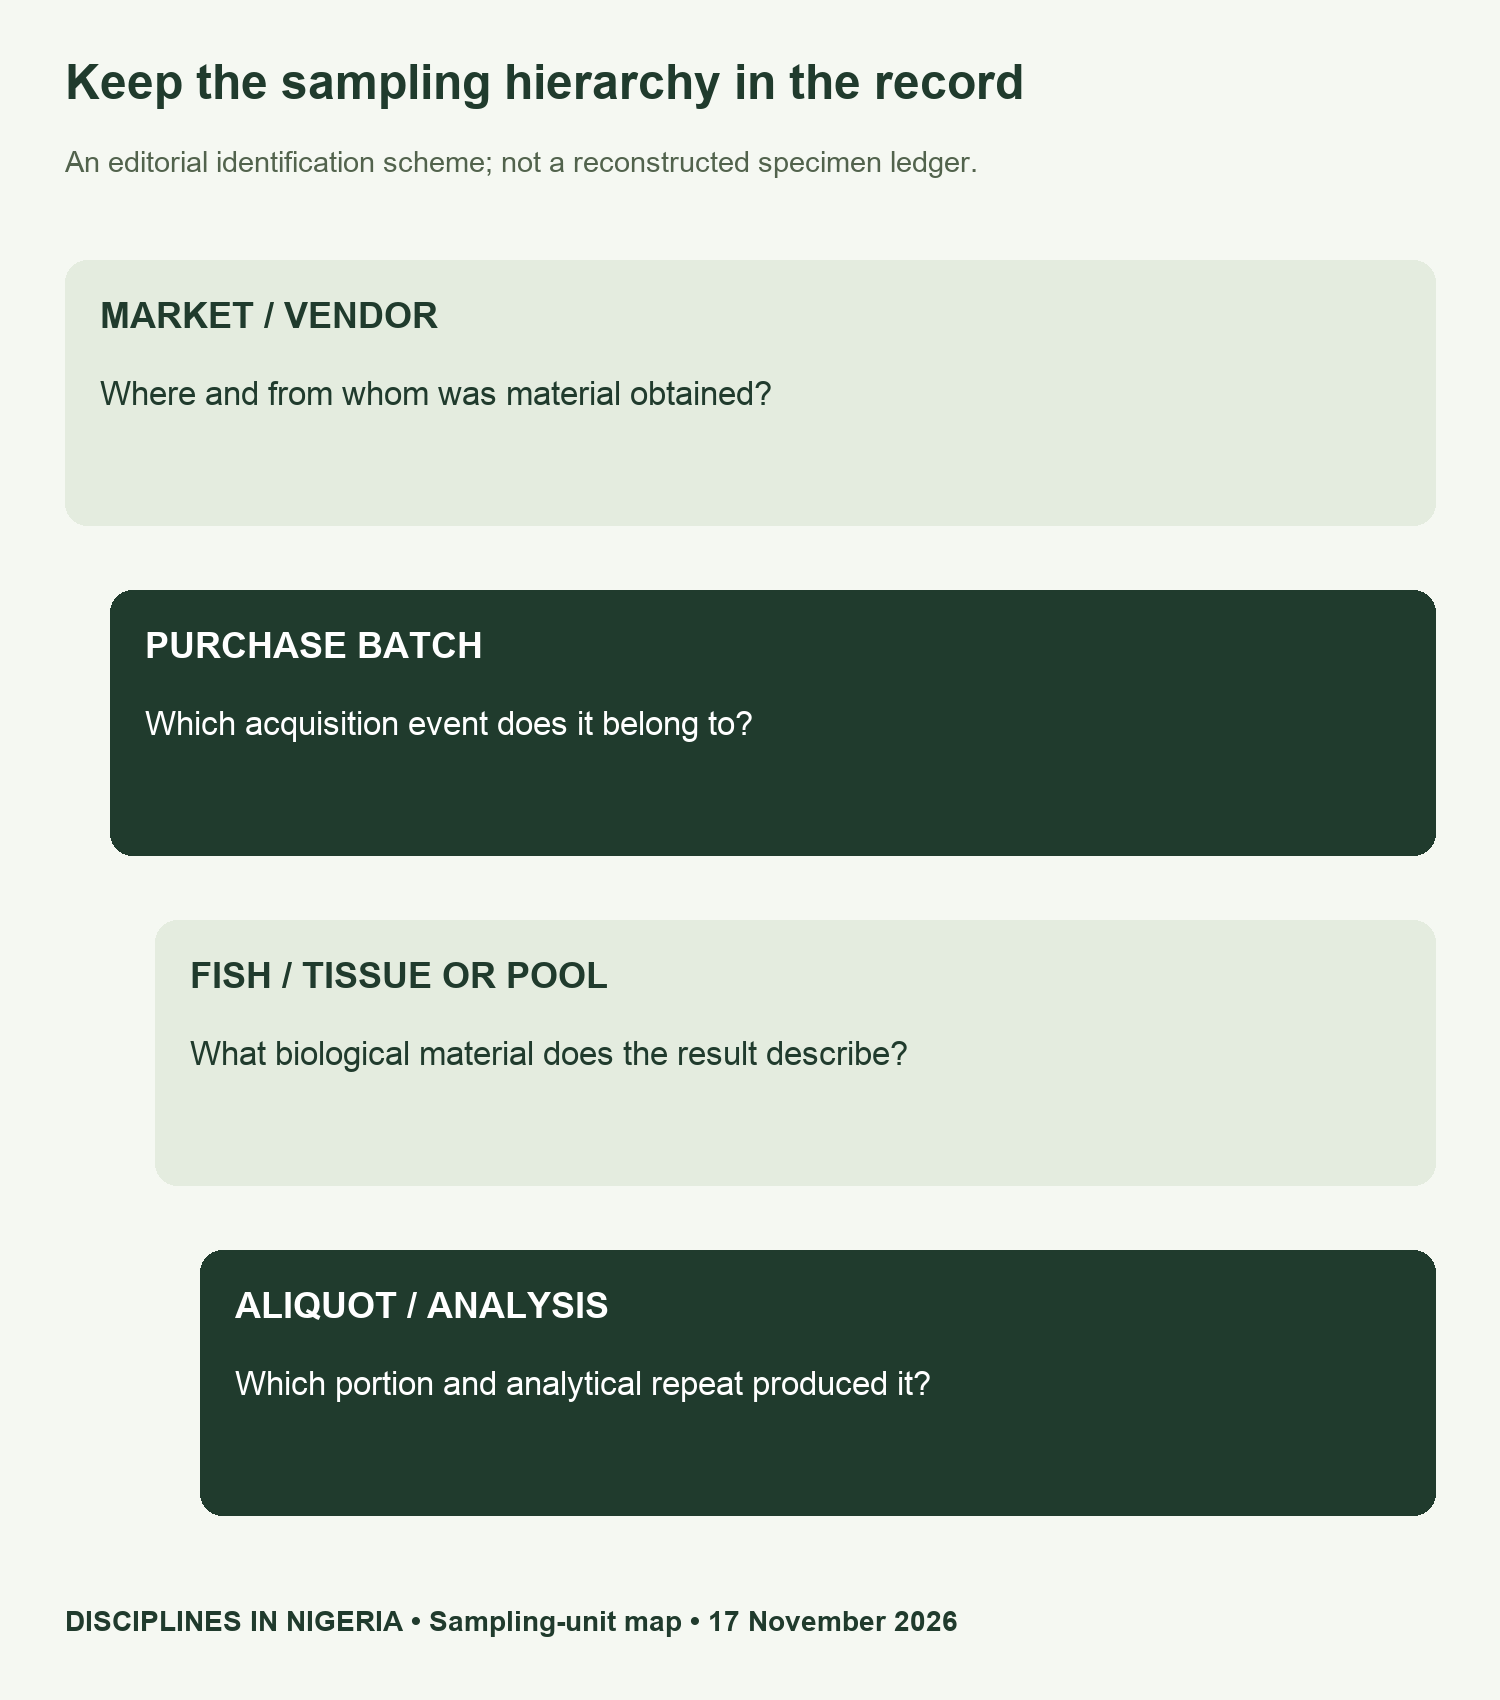
Begin with the acquisition event. Record the date, market, vendor code and purchase identifier. Then link each fish or pool to that event. A tissue or aliquot identifier should retain its parent link, so that several instrument readings cannot masquerade as several independent purchases.
The correct unit depends on the research question and design. Several fish from the same batch may share conditions, while repeated purchases can still cluster within vendors or markets. Discuss that dependence when planning analysis. A larger number of rows does not automatically create a larger independent sample.
The inspected methods discuss triplicate analysis but do not clearly establish the independent purchases in every design cell. We retain that limit rather than reconstructing a specimen count. The register is a blank proposal for future research, not a recovery of the authors’ underlying data.
Use a fictional example to see the difference
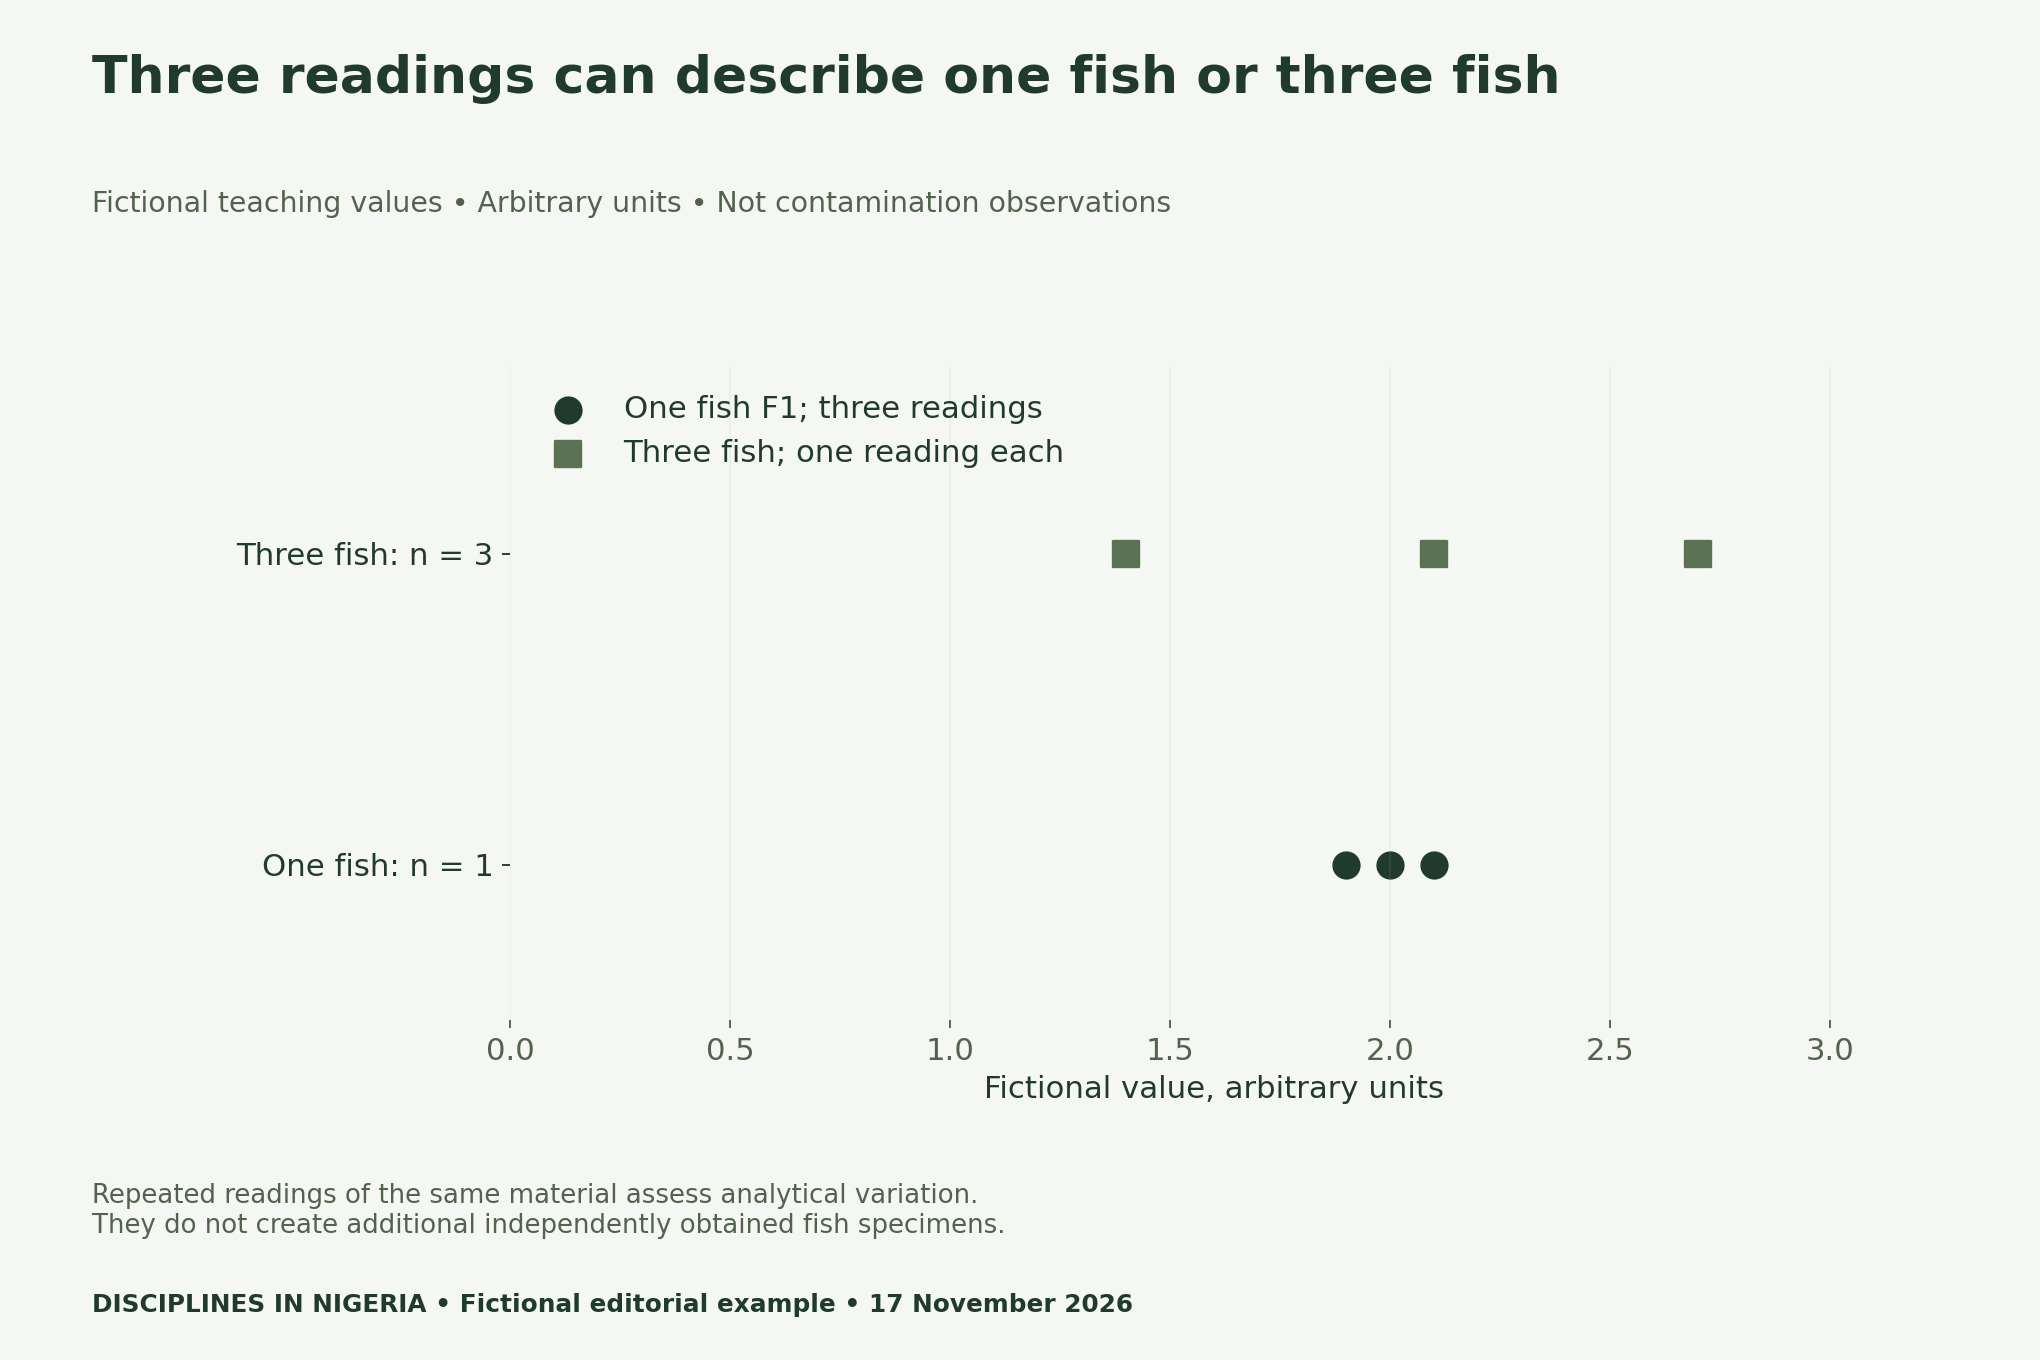
Suppose one fish produces readings of 2.0, 2.1 and 1.9 arbitrary units. There are three readings but one fish. In a different fictional design, three separately obtained fish produce 1.4, 2.1 and 2.7. Both tables have three rows, yet they answer different questions about variation.
A repeat helps assess measurement variation in the material under analysis. Independent acquisitions help examine variation across biological material, subject to the design’s other clustering. Keep both levels in the data, but do not count them interchangeably when calculating uncertainty or choosing a model.
Mark missing cells and preserve the reason
A blank cell can mean no purchase, lost material, an unusable assay, a result below a reporting limit or an unavailable record. Those states require different handling. In particular, an absent result does not mean a concentration of zero. Record the reason before deciding how to summarise the data.
Similarly, distinguish the month of acquisition from the date of laboratory analysis. A delayed measurement should not silently move a specimen into another seasonal group. Retain the original dates and document any derived season definition. A month label alone may hide important scheduling differences.
Keep the source and the claim at the same level
A market-purchased fish can have a supply chain extending beyond that market. A difference between market-coded samples does not by itself identify the contamination source. Source attribution would need additional evidence, such as origin, handling and environmental measurements appropriate to the question.
Historical sampling also cannot establish the condition of a market today. This article does not rank markets, advise readers to avoid a named seller or recalculate health risks. Its contribution is a transparent method for recording units and avoiding inflated counts.
For related work, see our Environmental archive. Before a new study begins, review the purchase, preparation and analysis plan with the appropriate supervisor and laboratory team. Keep the statistical plan tied to the independent units you can actually document.
Method, limitations and downloadable registers
We inspected the accepted manuscript’s methods on pages 2–3 on 17 November 2026. The grid uses its reported design dimensions. The dot plot uses fictional values supplied solely for teaching. Neither visual reproduces a source-study contamination figure or claims a complete observed sampling history.
We did not access a raw specimen ledger or verify independent purchases in every cell. Our worksheets therefore leave observed coverage and specimen counts open. Publication in November 2026 remains distinct from the August 2024–July 2025 collection period. No current safety finding or contamination-source attribution follows from this guide.
- Blank-status market, species and month design grid (CSV)
- Design arithmetic and sampling-unit definitions (CSV)
- Blank purchase, specimen and analysis register (CSV)
- Fictional repeat-versus-independent-fish example (CSV)
Suggested citation: Disciplines In Nigeria, “Seasonal Fish-Contaminant Research: Design the Sampling Grid Before Counting Samples”, 17 November 2026. Methods source: Laoye et al., DOI 10.1007/s42452-026-09911-4; original teaching graphics and registers by this publication.


