





Water quality index limitations in Nigeria deserve attention before a research paper becomes a public safety claim. An index combines selected inputs. If it leaves a contaminant out, a favourable score cannot settle the question that contaminant raises.
This guide uses a recent Kebbi publication to explain an evidence audit. Two charts, a parameter-inclusion infographic and four free CSV tools separate scores, records and verification needs. We do not classify water as safe or unsafe, identify pollution sources or recommend treatment.
Water quality index limitations in Nigeria: start with scope
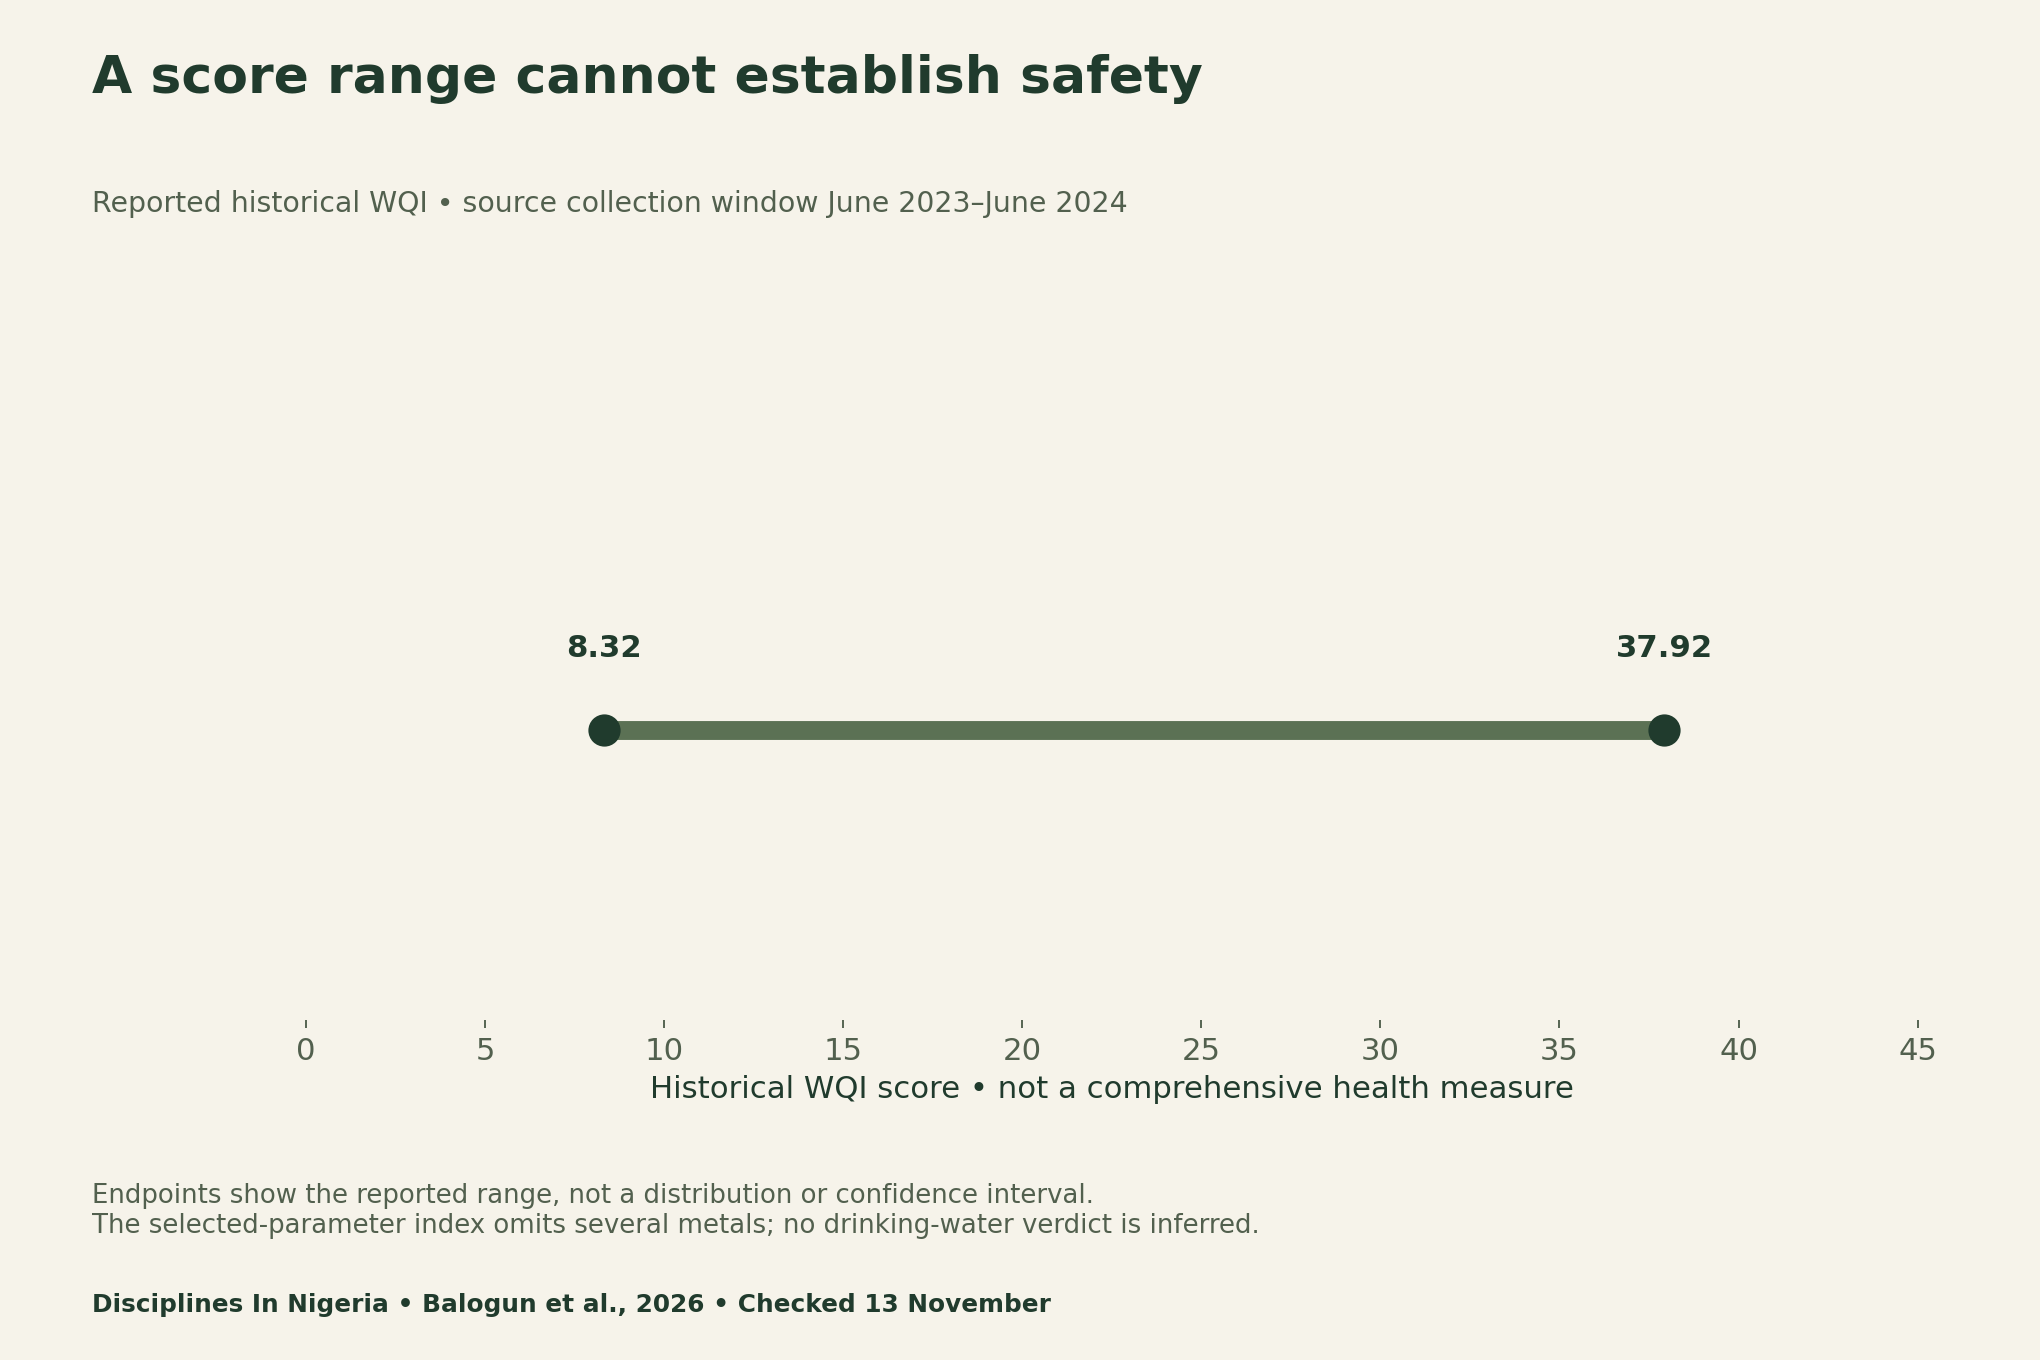
The Water Science article by Balogun and colleagues, published 9 November 2026, reports historical WQI values of 8.32–37.92 and a June 2023–June 2024 collection window. Its index includes 14 variables but excludes several metals. The figures are not new November 2026 water measurements.
Audit what the index includes and excludes
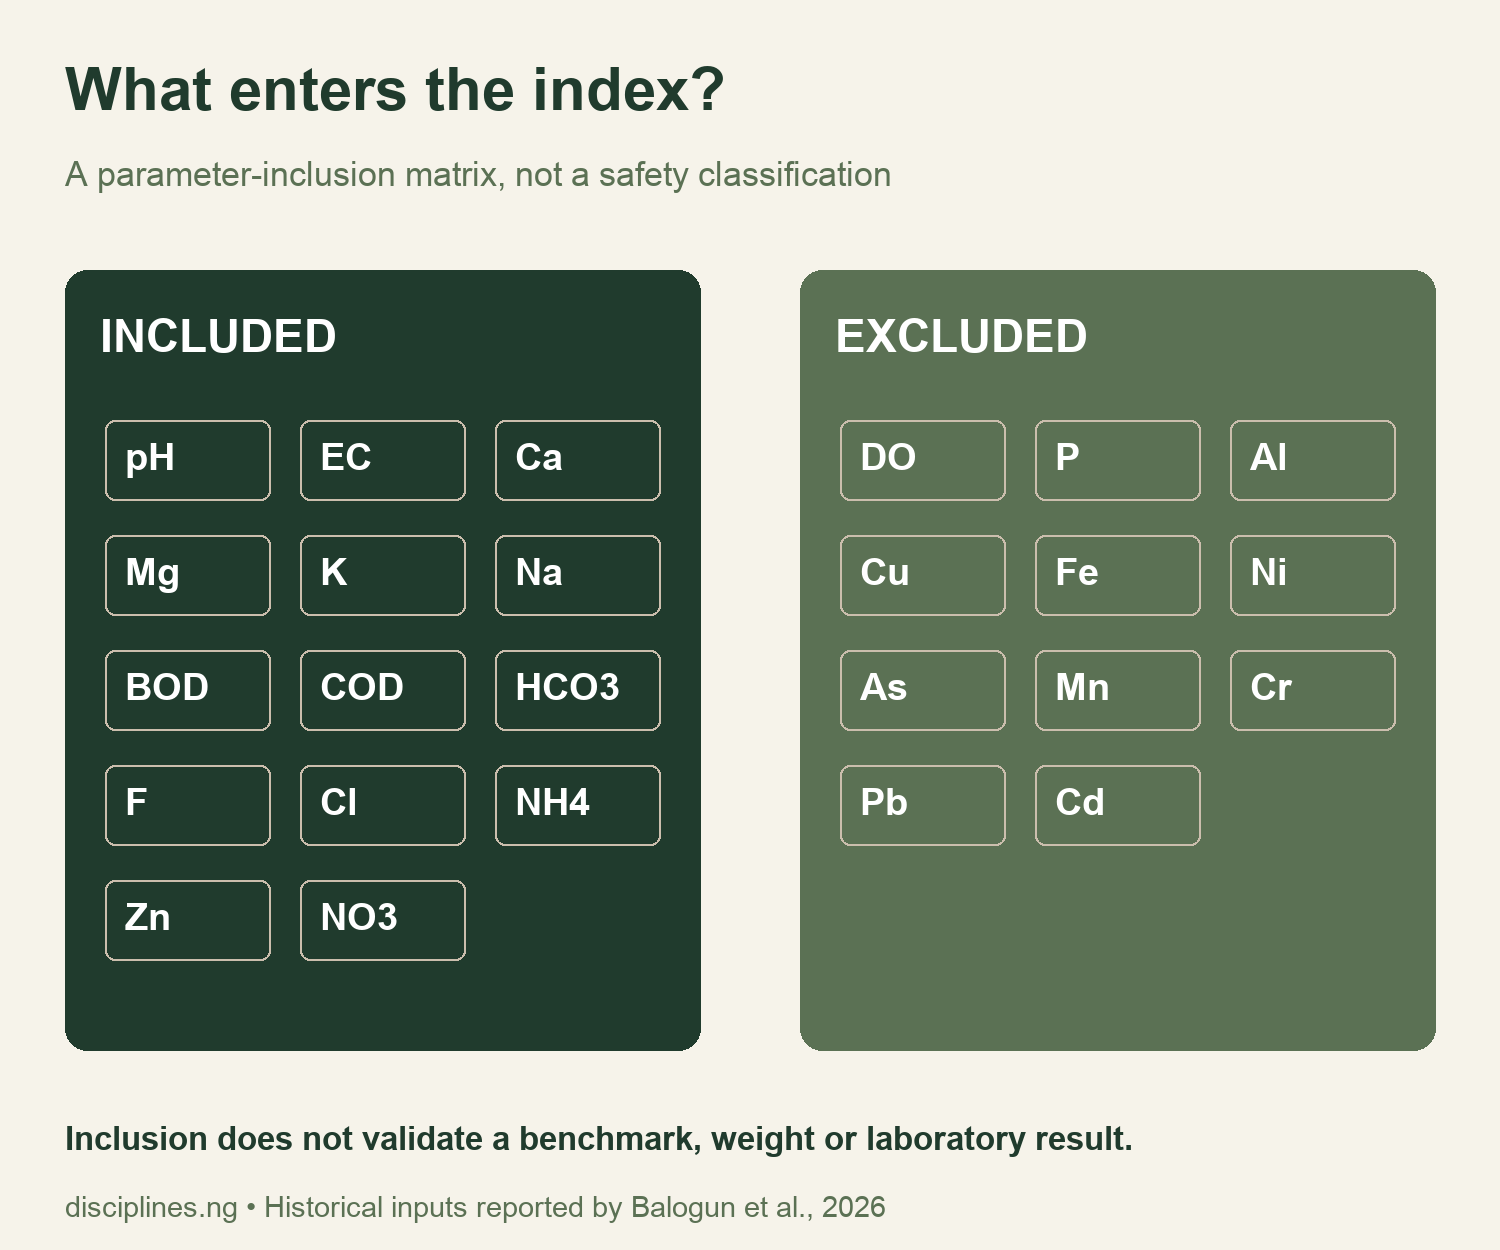
For your own review, preserve the parameter symbols, units and reporting basis. Also record why the study included each input and what reference value it used. A familiar organisation’s name beside a benchmark is not enough: the reviewer needs the exact document, intended use and relevant version.
Next, inspect how the calculation handles values on either side of a target. A transformation can change the meaning of a score. Reproduce a worked example only when the formula, units and reference values are clear. Keep any proposed correction separate from the published result.
Do not confuse records with independent sites
The source describes 120 records, 118 distinct site-code strings and two surface-water-labelled records. Repeated codes have unresolved identity implications. These counts do not establish 120 independent groundwater sites. Keep every original record while investigating the differences instead of deleting rows simply because a code repeats.
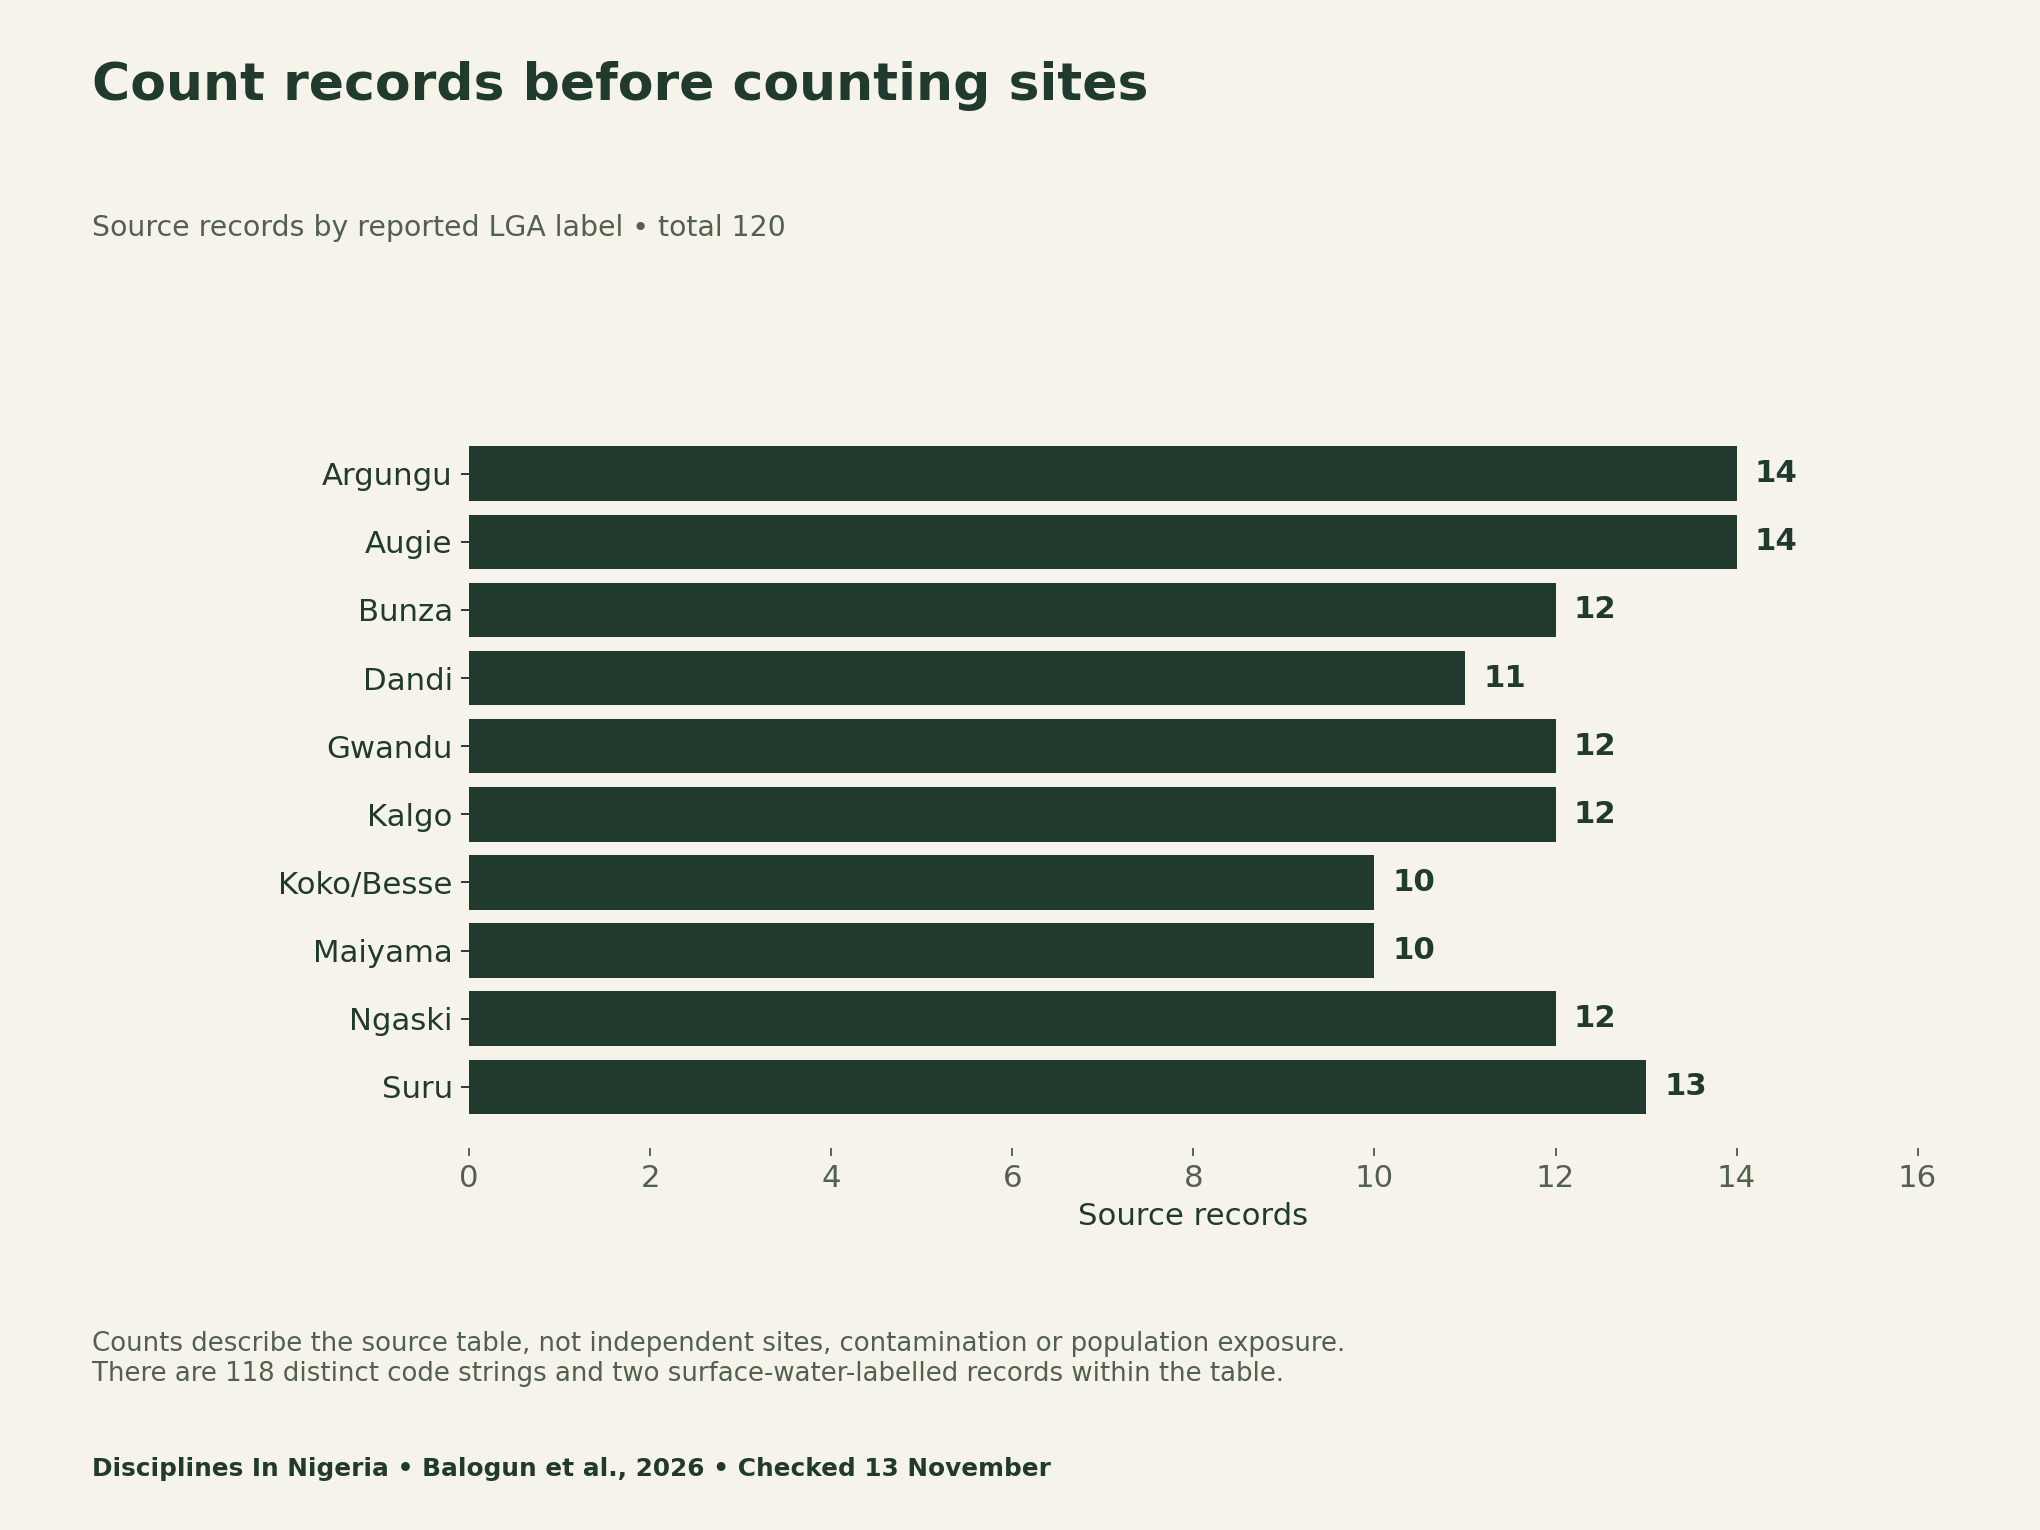
A repeated identifier may refer to a duplicate entry, another location or a different visit. Its meaning depends on the field record. Conversely, different identifiers can still refer to the same place. A unique text string is therefore not proof of an independent observation.
Keep a reconciliation trail
Create a stable source-row identifier and retain the original code alongside it. Add the recorded station name, water-source type, sampling date and coordinate reference. Then log the conflict, the document used to resolve it and the remaining uncertainty.
Do not silently change a station name to make a map look plausible. If a correction is justified, preserve the original value and the reason for the change. A reviewer should be able to trace the final table back to the source without guessing which rows disappeared.
Separate field replication from laboratory repetition
Several readings from one bottle do not automatically represent several independent field samples. Record the relationship among collection events, containers, subsamples and repeated analyses. Otherwise, a large row count can create a misleading impression of geographic or seasonal coverage.
For a future study, define the unit of analysis before choosing the statistical method. Ask whether the design supports a statement about a location, period, source type or wider population. The appropriate scope depends on the actual sampling and measurement evidence, not the most attractive map.
Request quality-control evidence before interpreting a result
Our audit worksheet asks for preservation records, blanks, duplicates, calibration checks, recoveries and method-specific reporting limits. These are document requests, not instructions for hazardous laboratory work. Qualified laboratories and responsible institutions should design and carry out confirmatory work.
A missing value is not zero. Likewise, a displayed zero does not by itself establish non-detection or compliance. Record the source’s notation and the laboratory’s reporting convention. If the method limit is unavailable, retain that uncertainty rather than assigning a reassuring meaning.
Treat publication labels and data statements as audit items
The publisher labels the paper “Editorial”, while it presents empirical analyses. Its data-availability statement says no datasets were generated or analysed. We retain that mismatch as a question for clarification, rather than resolving it ourselves or alleging misconduct.
When reviewing any paper, compare the article type, methods, supplements and availability statement. Ask where the underlying observations and documentation can be inspected. A broken or inconsistent evidence chain limits what an independent reader can reproduce, even when a chart is visually convincing.
Keep maps and source claims within their evidence
A map can display reported observations or modelled values. It cannot, by appearance alone, establish drinking-water safety or explain where a contaminant came from. Before remapping, resolve identities, source types, coordinate systems and the choices used for interpolation.
Correlation also needs a separate interpretation. Variables can move together for several reasons, including shared conditions or measurement choices. A causal source claim requires additional evidence suited to that claim. Avoid naming a local activity as the cause merely because it lies near a coloured map area.
Water quality index limitations in Nigeria: free audit tools
To audit water quality index limitations in Nigeria, download the scope register and parameter matrix to preserve the reported boundaries. Use the blank reconciliation sheet and quality audit for your own document review. These are original editorial organising tools, not validated laboratory protocols, regulatory approvals or health advice.
- Reported WQI scope and denominator register (CSV)
- Historical parameter-inclusion matrix (CSV)
- Blank source-record reconciliation worksheet (CSV)
- Sampling and laboratory evidence audit (CSV)
For another denominator audit, see our SIWES evaluation guide. Our school-community research guide explains how to separate an indicator from the outcome it is meant to represent.
Methods, limitations and citation
We checked the primary publisher page on 13 November 2026, transcribed the selected scope facts and summed the reported LGA record counts to 120. No raw laboratory data were independently validated. We did not recompute the WQI, reproduce source maps or estimate health risk. The original charts display facts for critical discussion, without adapting the publisher’s graphics.
Suggested citation: Disciplines In Nigeria, 13 November 2026, “Water Quality Index Research in Nigeria: Check What the Score Leaves Out”, with Balogun et al., DOI 10.1007/s44533-026-00088-8. Retain the source’s unresolved documentation limits when citing this guide. For decisions about a particular water supply, seek current, appropriate local testing and competent public-health guidance.


