



Eti-Osa satellite bathymetry survey planning starts with a question about use: can a depth surface help identify where a new survey needs better evidence? A smooth map or small overall bias cannot answer that alone. The depth range, reference measurements and timing must travel with the result.
The official UNILAG FEIC programme places CMT-41 in the Geomatics session on 18 November 2026. We checked Feyisetan and colleagues’ conference slides, rather than treating the presentation as a newly published journal article. Our contribution is a band-level reading, a transparent arithmetic reconciliation and a reusable use-boundary worksheet.
Eti-Osa satellite bathymetry survey planning: establish the evidence chain
The slides match 870 ten-metre pixels, split into 697 calibration and 173 validation pixels using 30-metre blocks. The satellite image dates to 17 November 2025; UAV and field work took place on 23 April 2026. The reference therefore combines different instruments and different dates, rather than a simultaneous census of seabed depths.
For a student audit, sketch that evidence chain before interpreting accuracy. Ask which observations train a model and which test it. Also distinguish field checks of a drone from validation of a satellite model against that drone. Those layers answer different questions. A reference with uncertainty does not become exact simply because it appears on the right side of a comparison.
Read the sign of the bias before averaging it
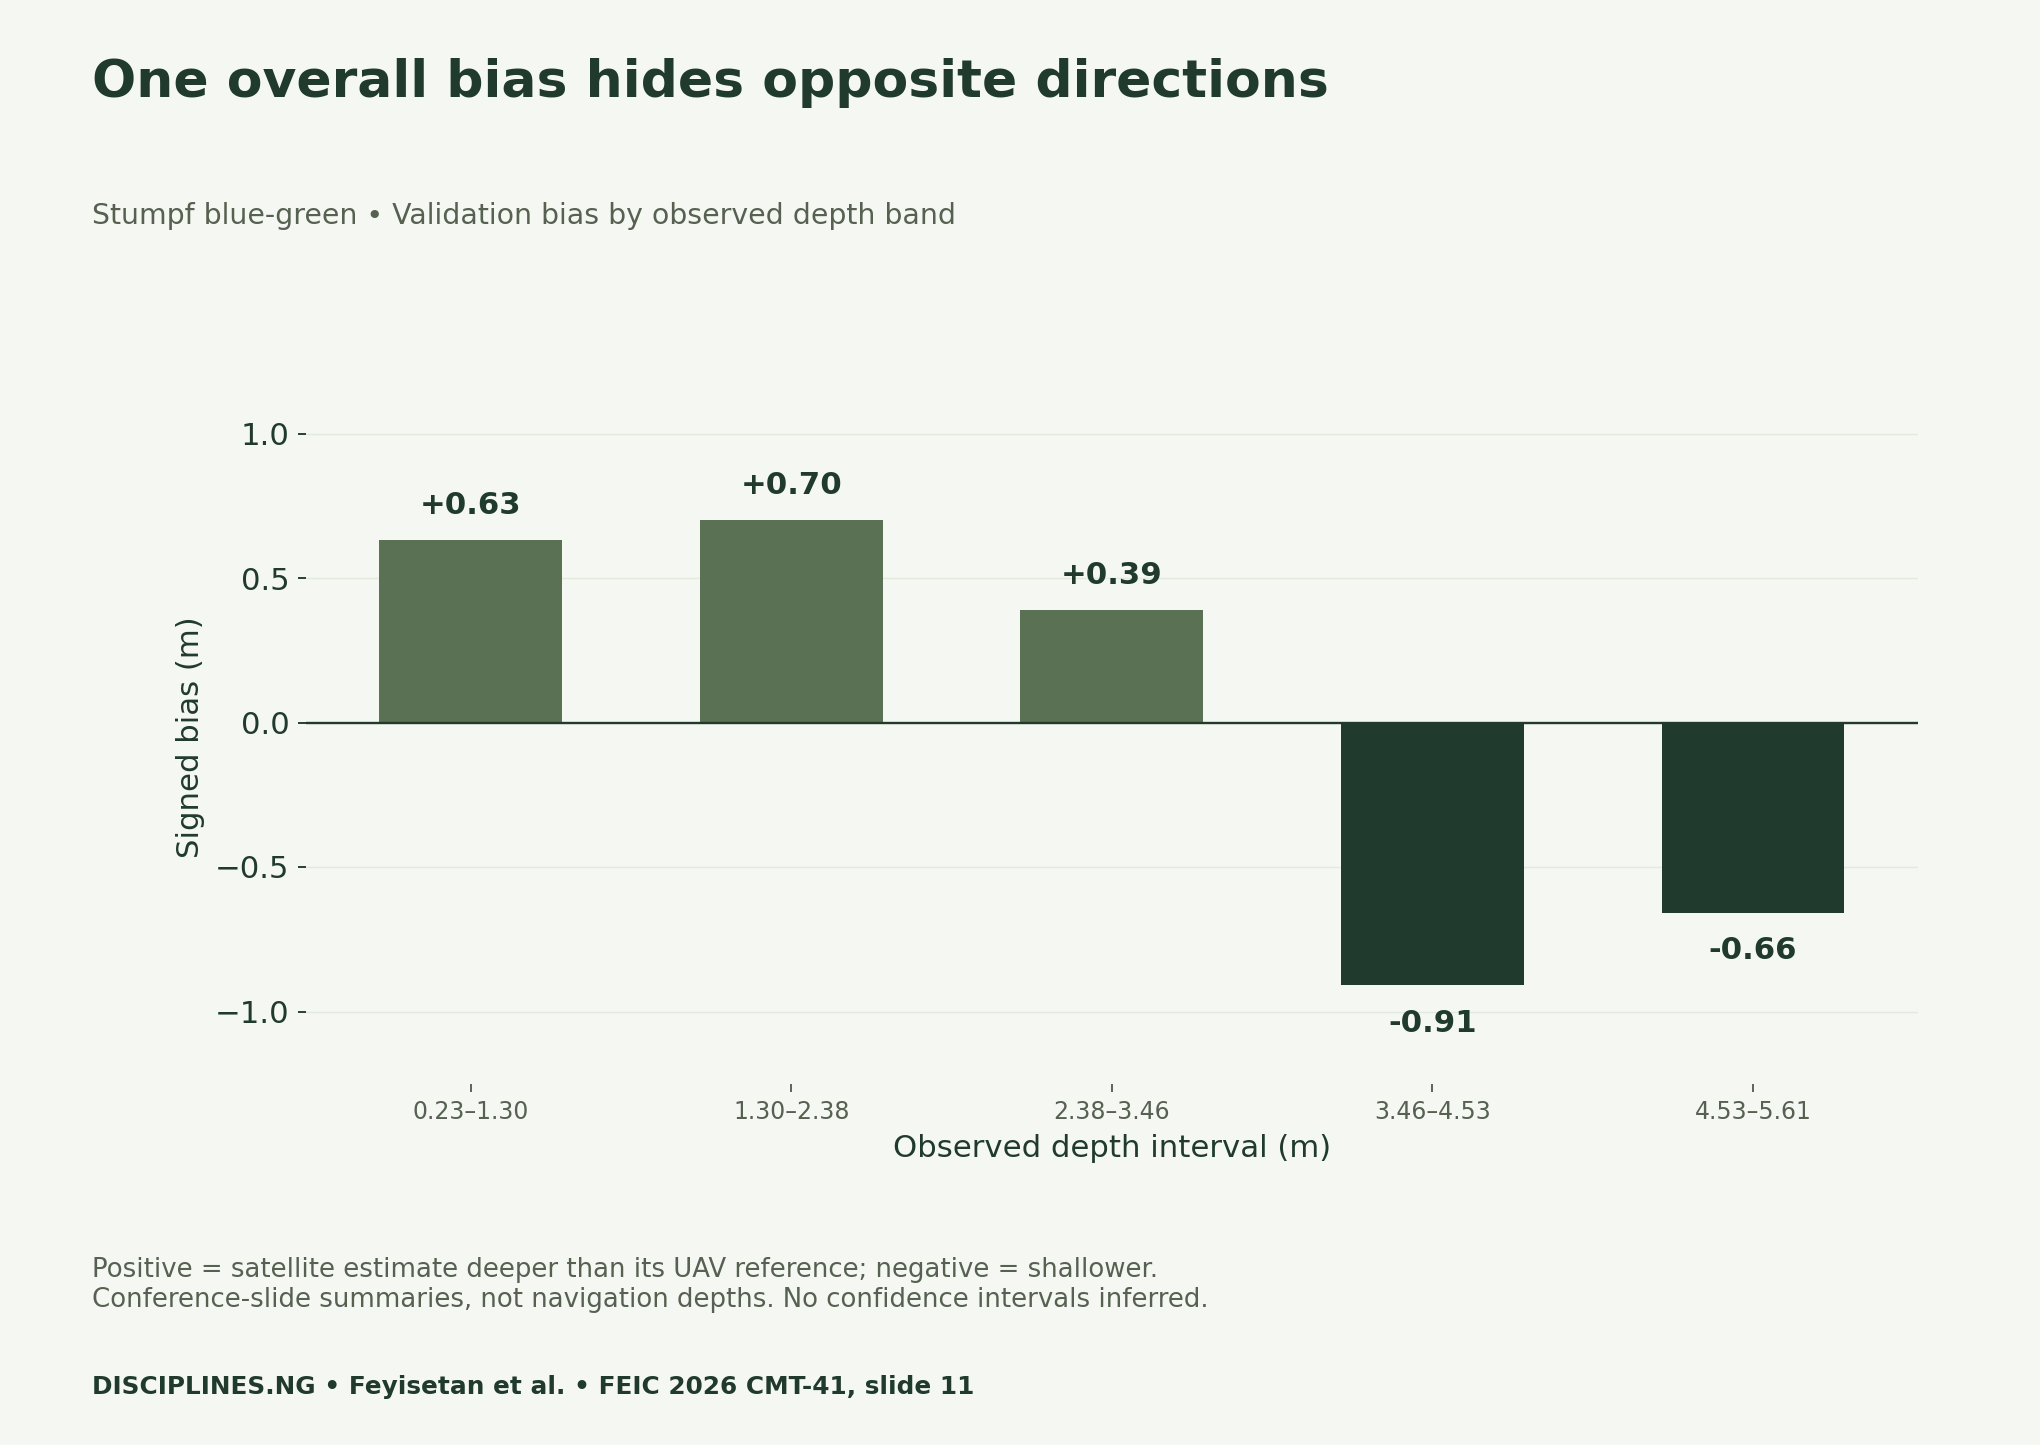
The shallow bands have positive bias, while the two deepest bands have negative bias. The reported overall bias is about −0.11 m. Opposite signs can partly cancel when averaged, so a modest total does not establish small errors throughout the depth range. Read direction and support together before deciding what needs closer investigation.
Bias is an average signed difference. It does not tell you the largest error, the full spread of errors or the uncertainty of a particular pixel. Consequently, do not apply the displayed band bias as a correction to a new shoreline. That would require a justified calibration and independent checks, not a subtraction copied from a blog chart.
Check the thin middle band
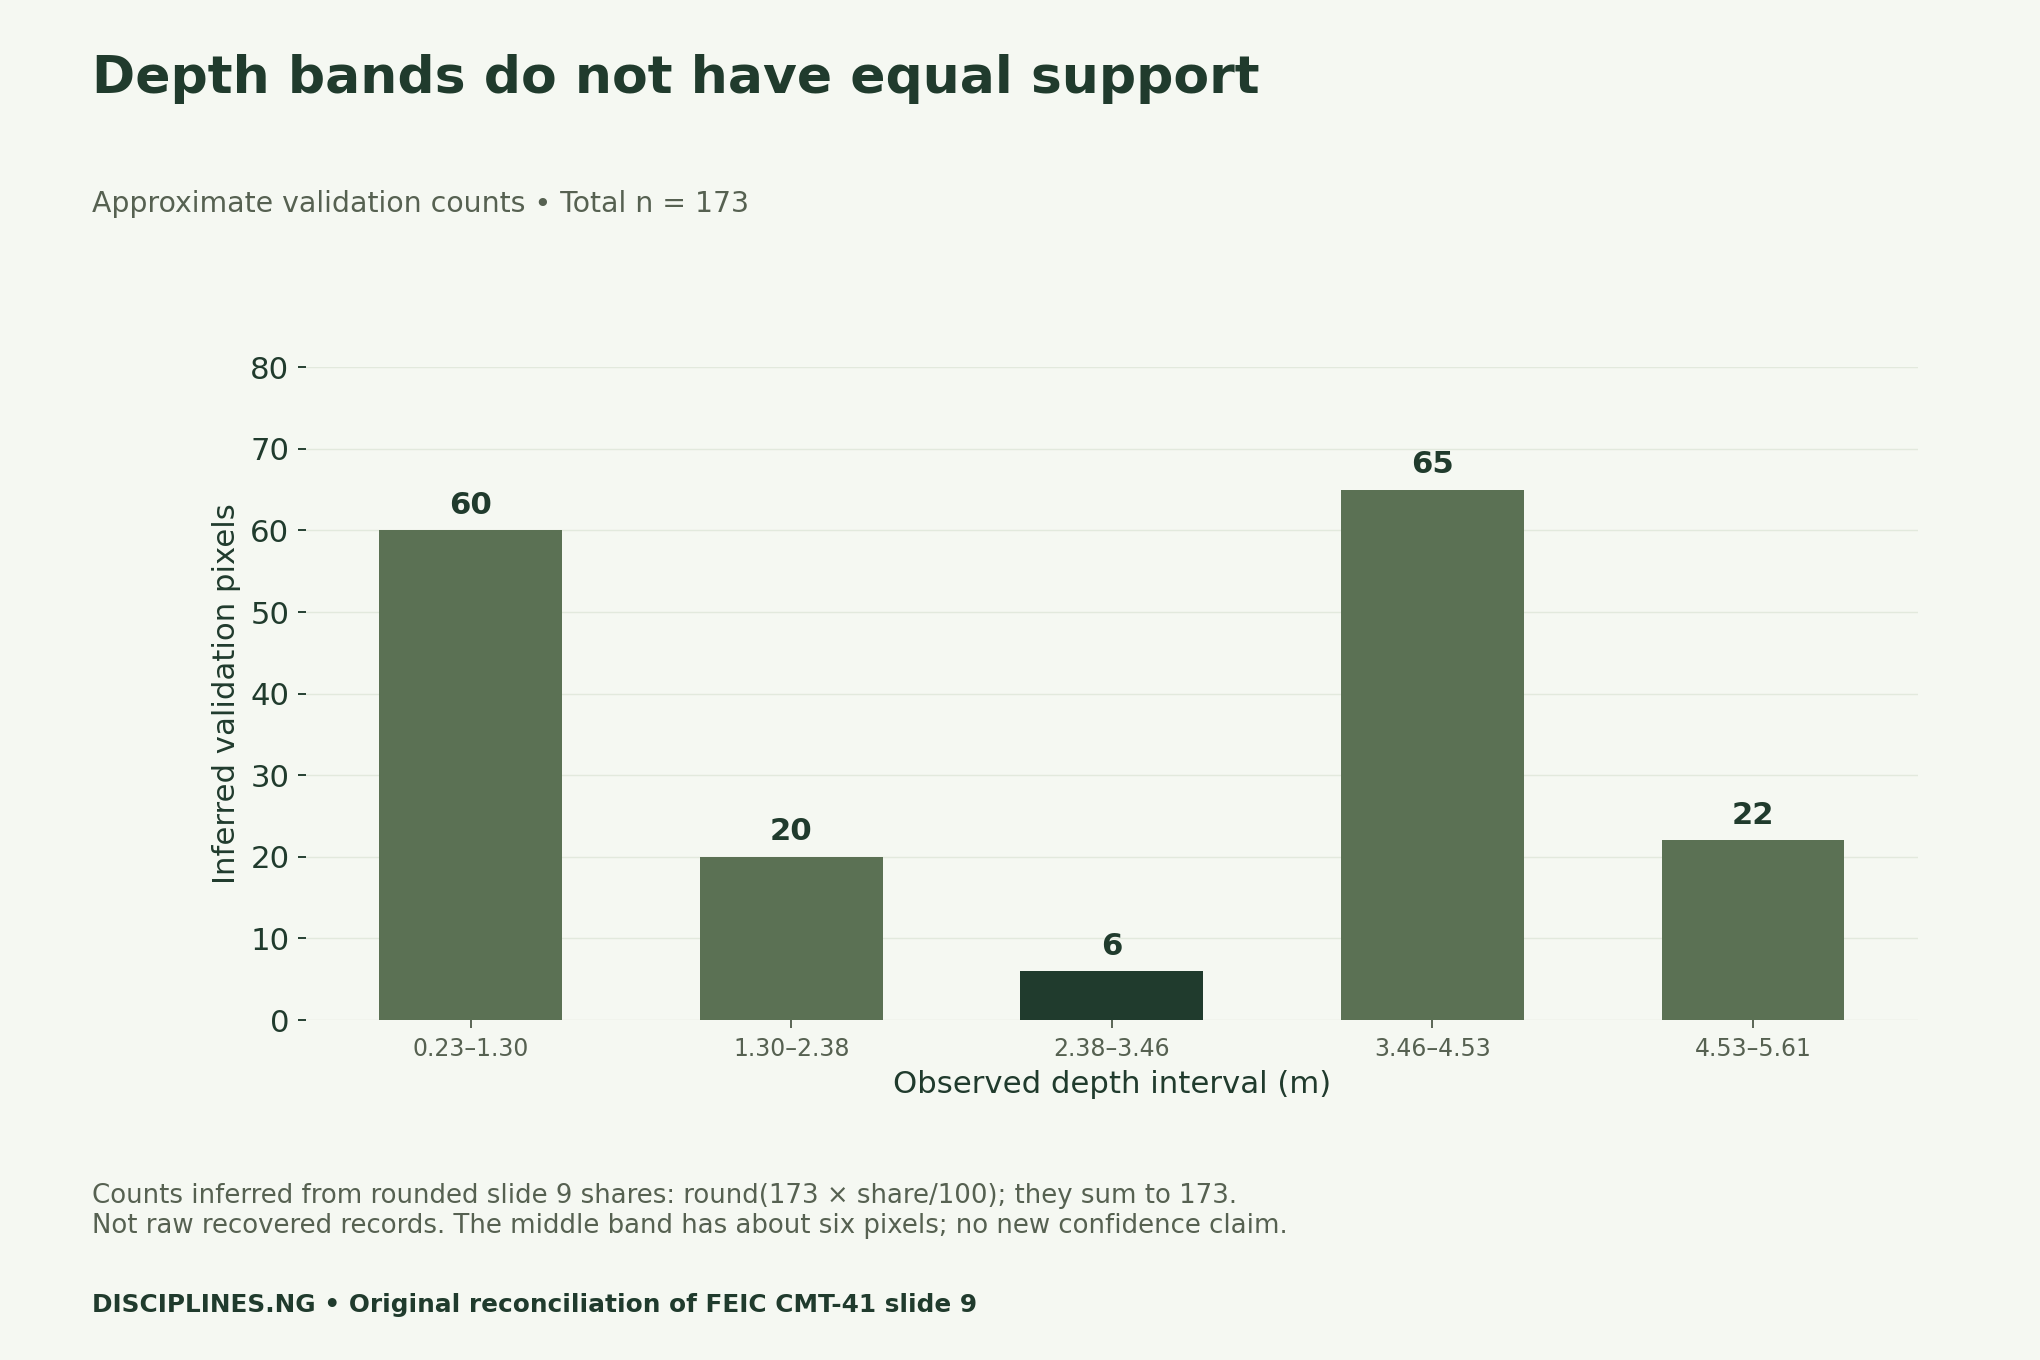
Our reconstruction multiplies each rounded validation share by 173 and rounds to a whole count. This gives 60, 20, 6, 65 and 22, summing to 173. It is a consistency check, not new field data. The source percentages sum to 100.1% because of rounding; that is another reason to retain the approximation label.
Weighting the rounded band biases by those inferred counts gives about −0.1125 m. This agrees after rounding with the displayed overall −0.11 m. The agreement checks arithmetic only. It does not validate the surface, establish independence between nearby pixels or make the small middle band as informative as the larger bands.
Set a boundary around the proposed use
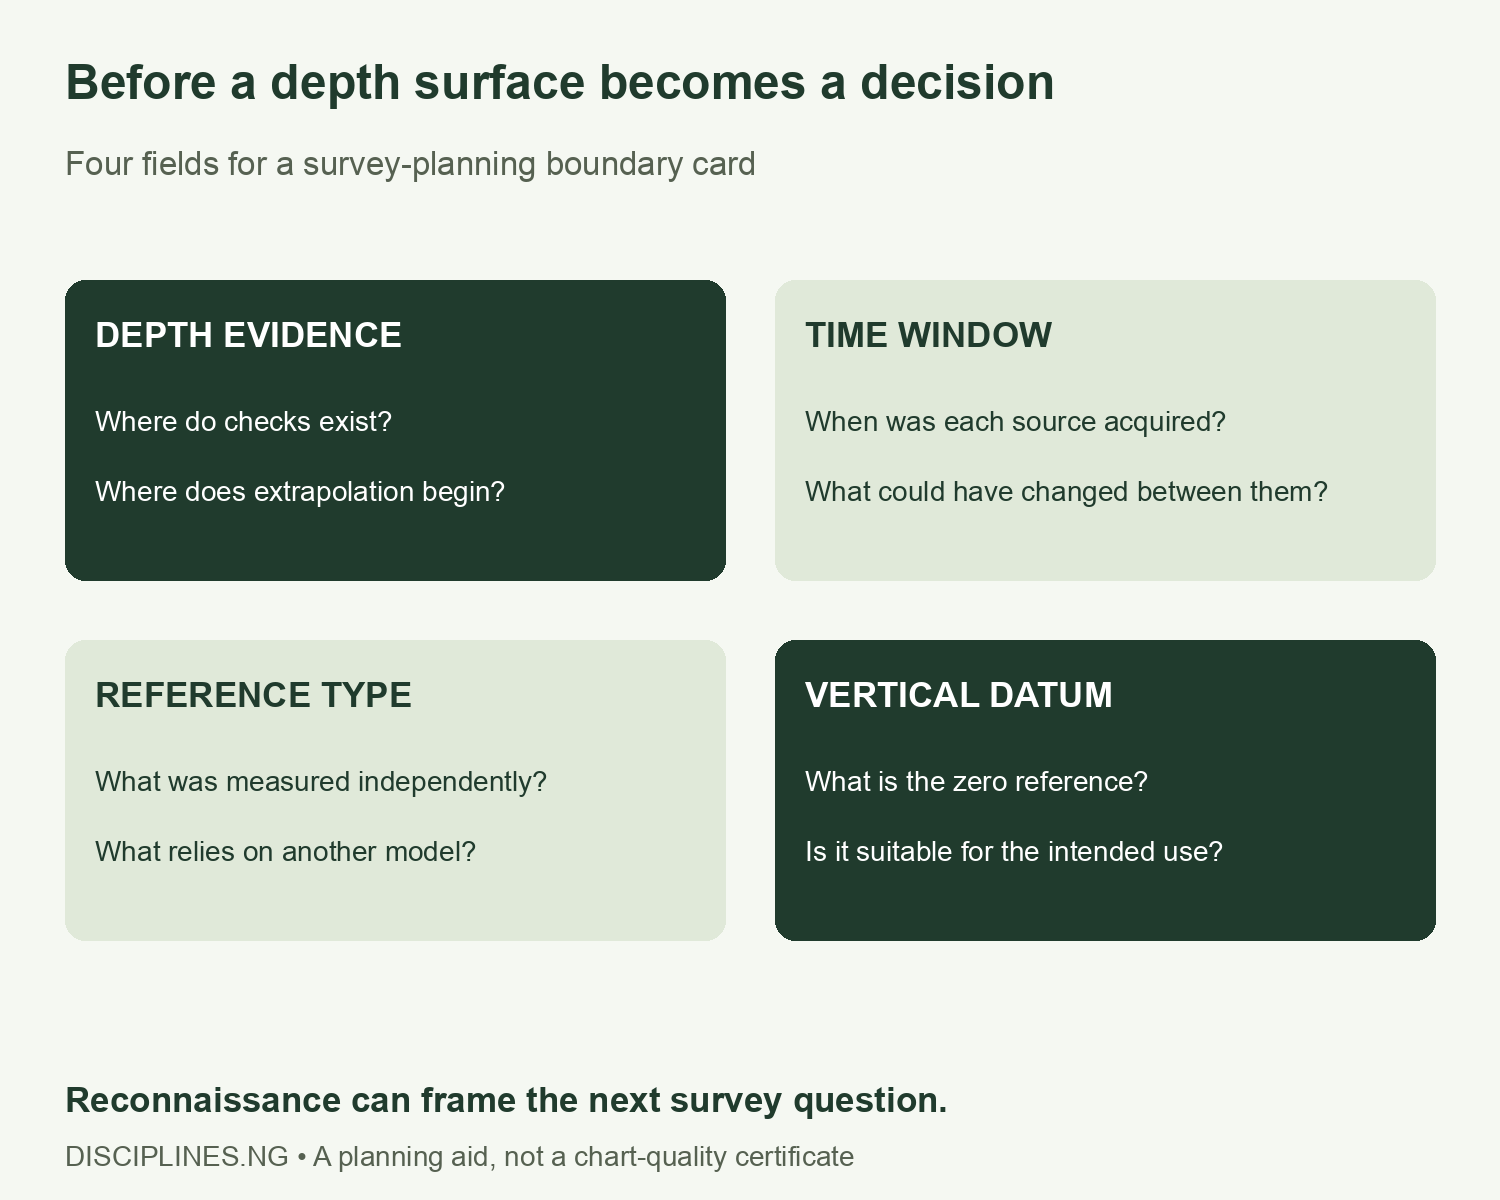
Begin the worksheet with one precise use. For example, a research team could ask where further measurements are needed to investigate a depth transition. That is a planning question. A vessel route, dredging volume or engineering quantity is a different decision with different evidence requirements. Do not let the same attractive graphic silently serve all four purposes.
Next, record the checked depth interval and flag areas outside it. The slides identify depths beyond 5.61 m as extrapolated and note no chart-datum reduction. Transfer-site predictions lack independent reference depths. Those boundaries prevent a plausibility check from becoming a validation claim. They also define useful questions for the next field campaign.
Then record source dates and reference type. A coastal surface may change between acquisitions. A time gap therefore deserves a field in the audit, even when a study discusses tidal offsets separately. The planning card asks what could have changed; it does not calculate that change or attribute every residual to a single cause.
Use standards as requirements, not a badge
The International Hydrographic Organization’s standards page provides the official source for survey standards. A professional assessment should start with the actual project requirements and applicable specification. This article does not assign an IHO survey order, certify CATZOC status or establish navigation fitness from a reported error summary.
For a supervised student exercise, compare the proposed use with the documented evidence and list the unresolved requirements. If the datum, reference coverage or independent checks are missing, leave them unresolved. Do not replace an empty field with a reassuring adjective. The useful output is a clear follow-up question and an accountable reviewer, not an unsupported quality label.
Methods and four reusable downloads
We checked slides 7, 9, 11–15 of the primary presentation. The source CSV keeps the five intervals, reported biases and rounded shares together. The reconciliation file labels counts as inferred and shows the weighted check. We did not obtain pixel-level observations or independently verify the map.
The blank worksheet separates proposed use, time window, reference type, datum and required follow-up. Its entries should describe evidence, not private field records or credentials. For related context, browse Engineering and the Research & Reports archive.
- Depth-band bias, shares and inferred counts (CSV)
- Reproducible bias reconciliation (CSV)
- Blank survey use-boundary worksheet (CSV)
- Evidence dates and interpretation dictionary (CSV)
Source: Feyisetan MD and colleagues, CMT-41, FEIC 2026, University of Lagos; original slides. Charts redraw the numerical summaries and identify our added calculations; no source map is reproduced. Suggested citation: “Eti-Osa Satellite Bathymetry: A Survey-Planning Boundary”, Disciplines In Nigeria, 21 November 2026.


