






Missing data in Nigerian public health research can change which participants contribute to each result. A paper’s total sample does not automatically supply the denominator for every percentage or regression model. Start by reconciling those analysis stages before interpreting an association or repeating a health headline.
This worked Ibadan example provides four original charts, an evidence-matrix infographic and four free CSV tools. We reproduce aggregate arithmetic and flag a source-label conflict. We have no individual records and have not imputed values, refitted models or estimated the direction of missing-data bias. Research checked on 9 November 2026.
Read the community and fieldwork boundary first
The Olasehinde and colleagues paper published on 4 November 2026 describes 504 adults in an Ibadan community survey. Fieldwork occurred in December 2024–January 2025. Its accepted manuscript is an early version subject to editing. The observations are not national prevalence figures or measurements taken in November 2026.
For a research audit, record the population, recruitment and reference period before extracting numbers. A date on the publisher page tells you when research became available, not when observations were made. Keep the source version as well, because an accepted manuscript may later receive clarifications or formatting changes.
Missing data in public health: reconcile the denominators
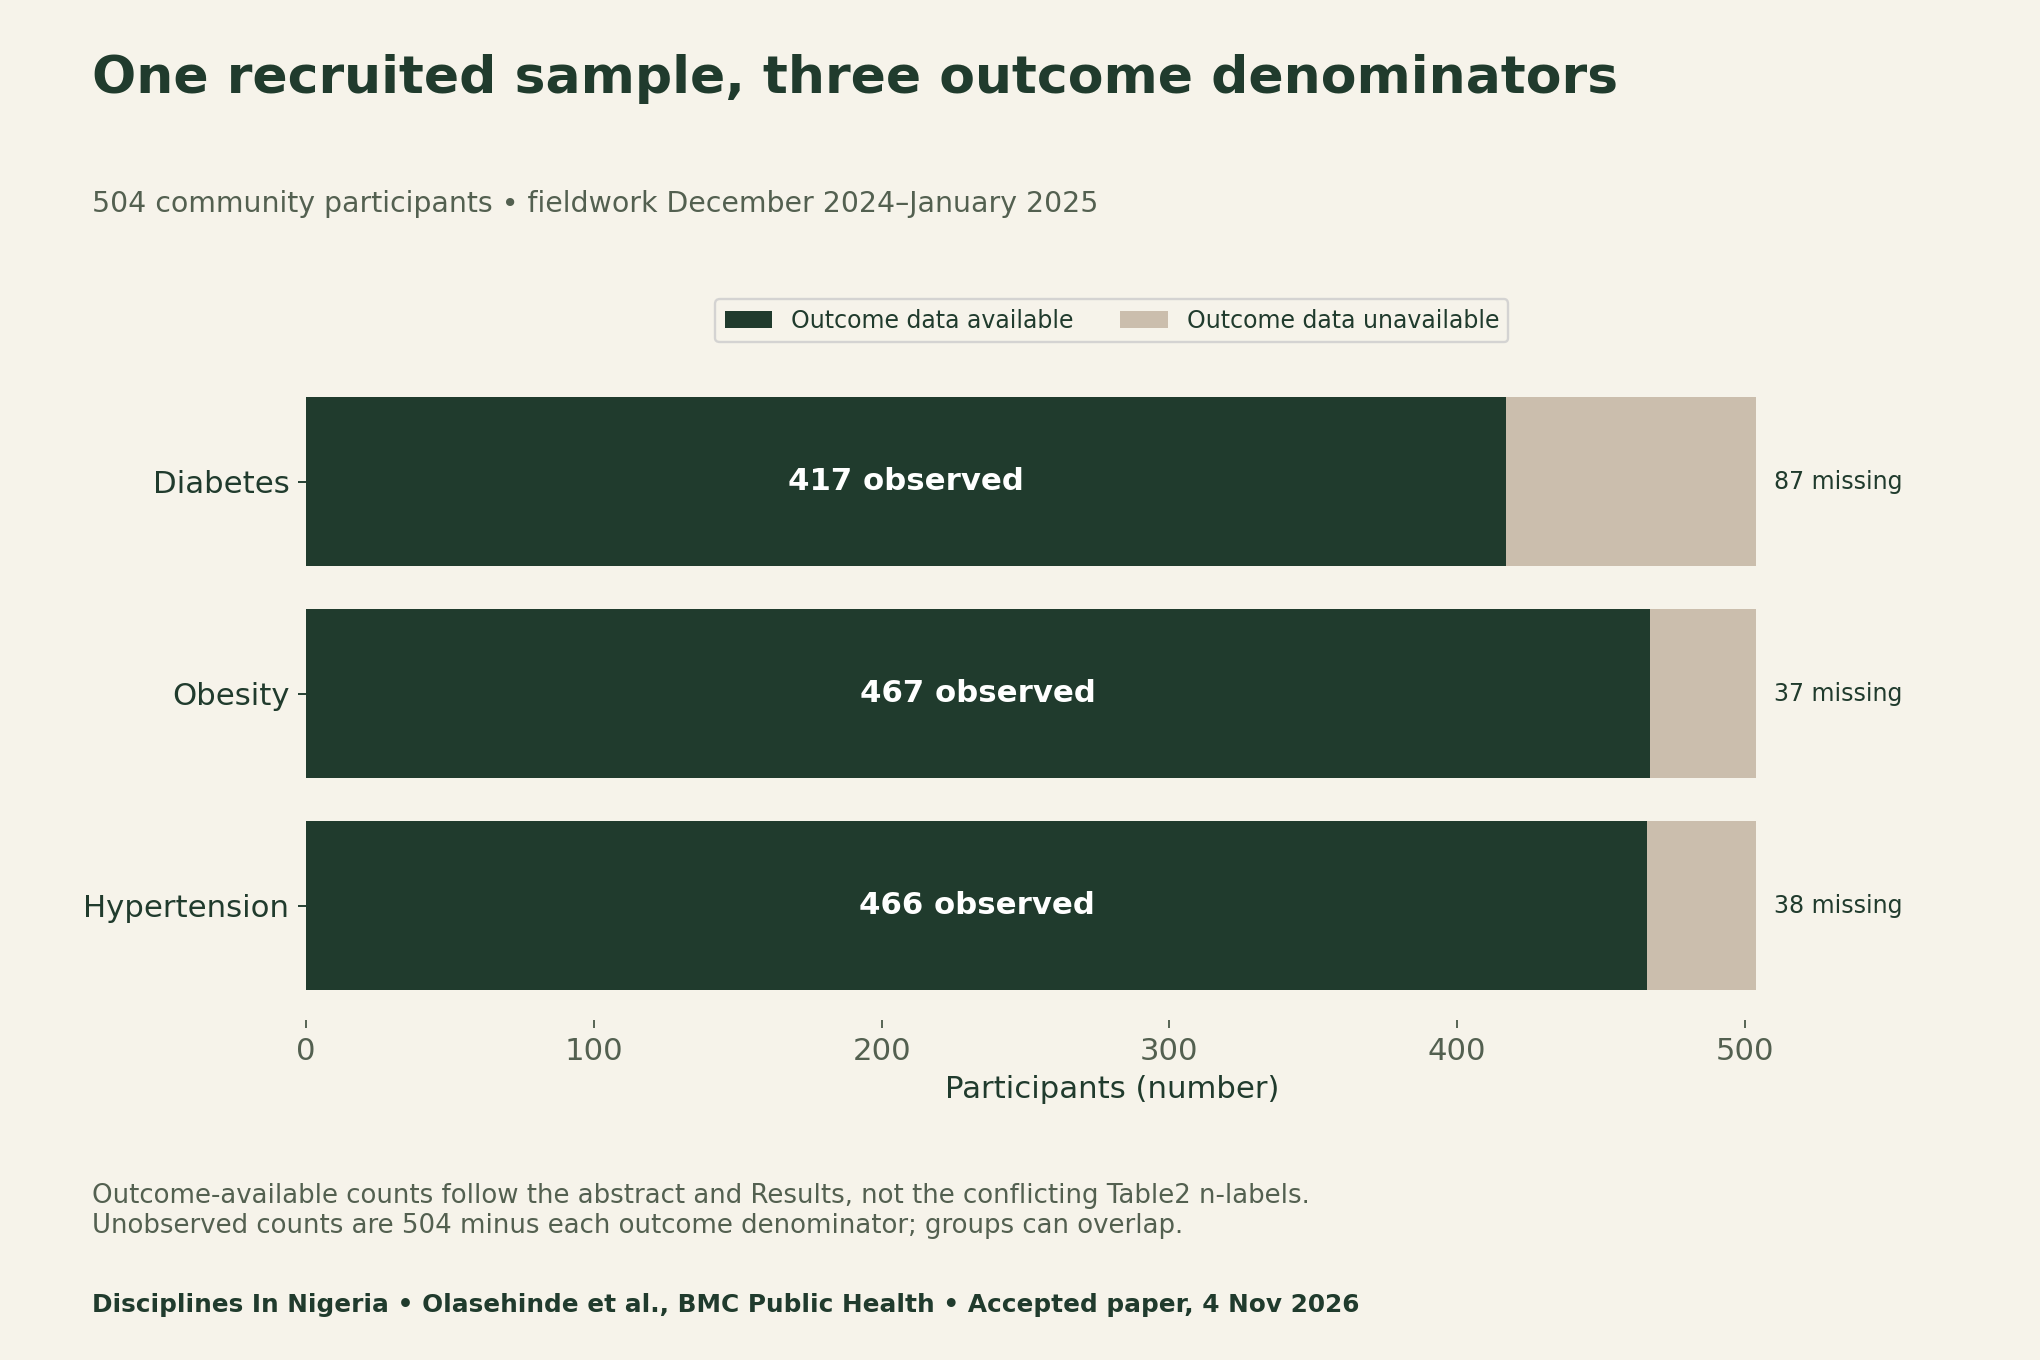
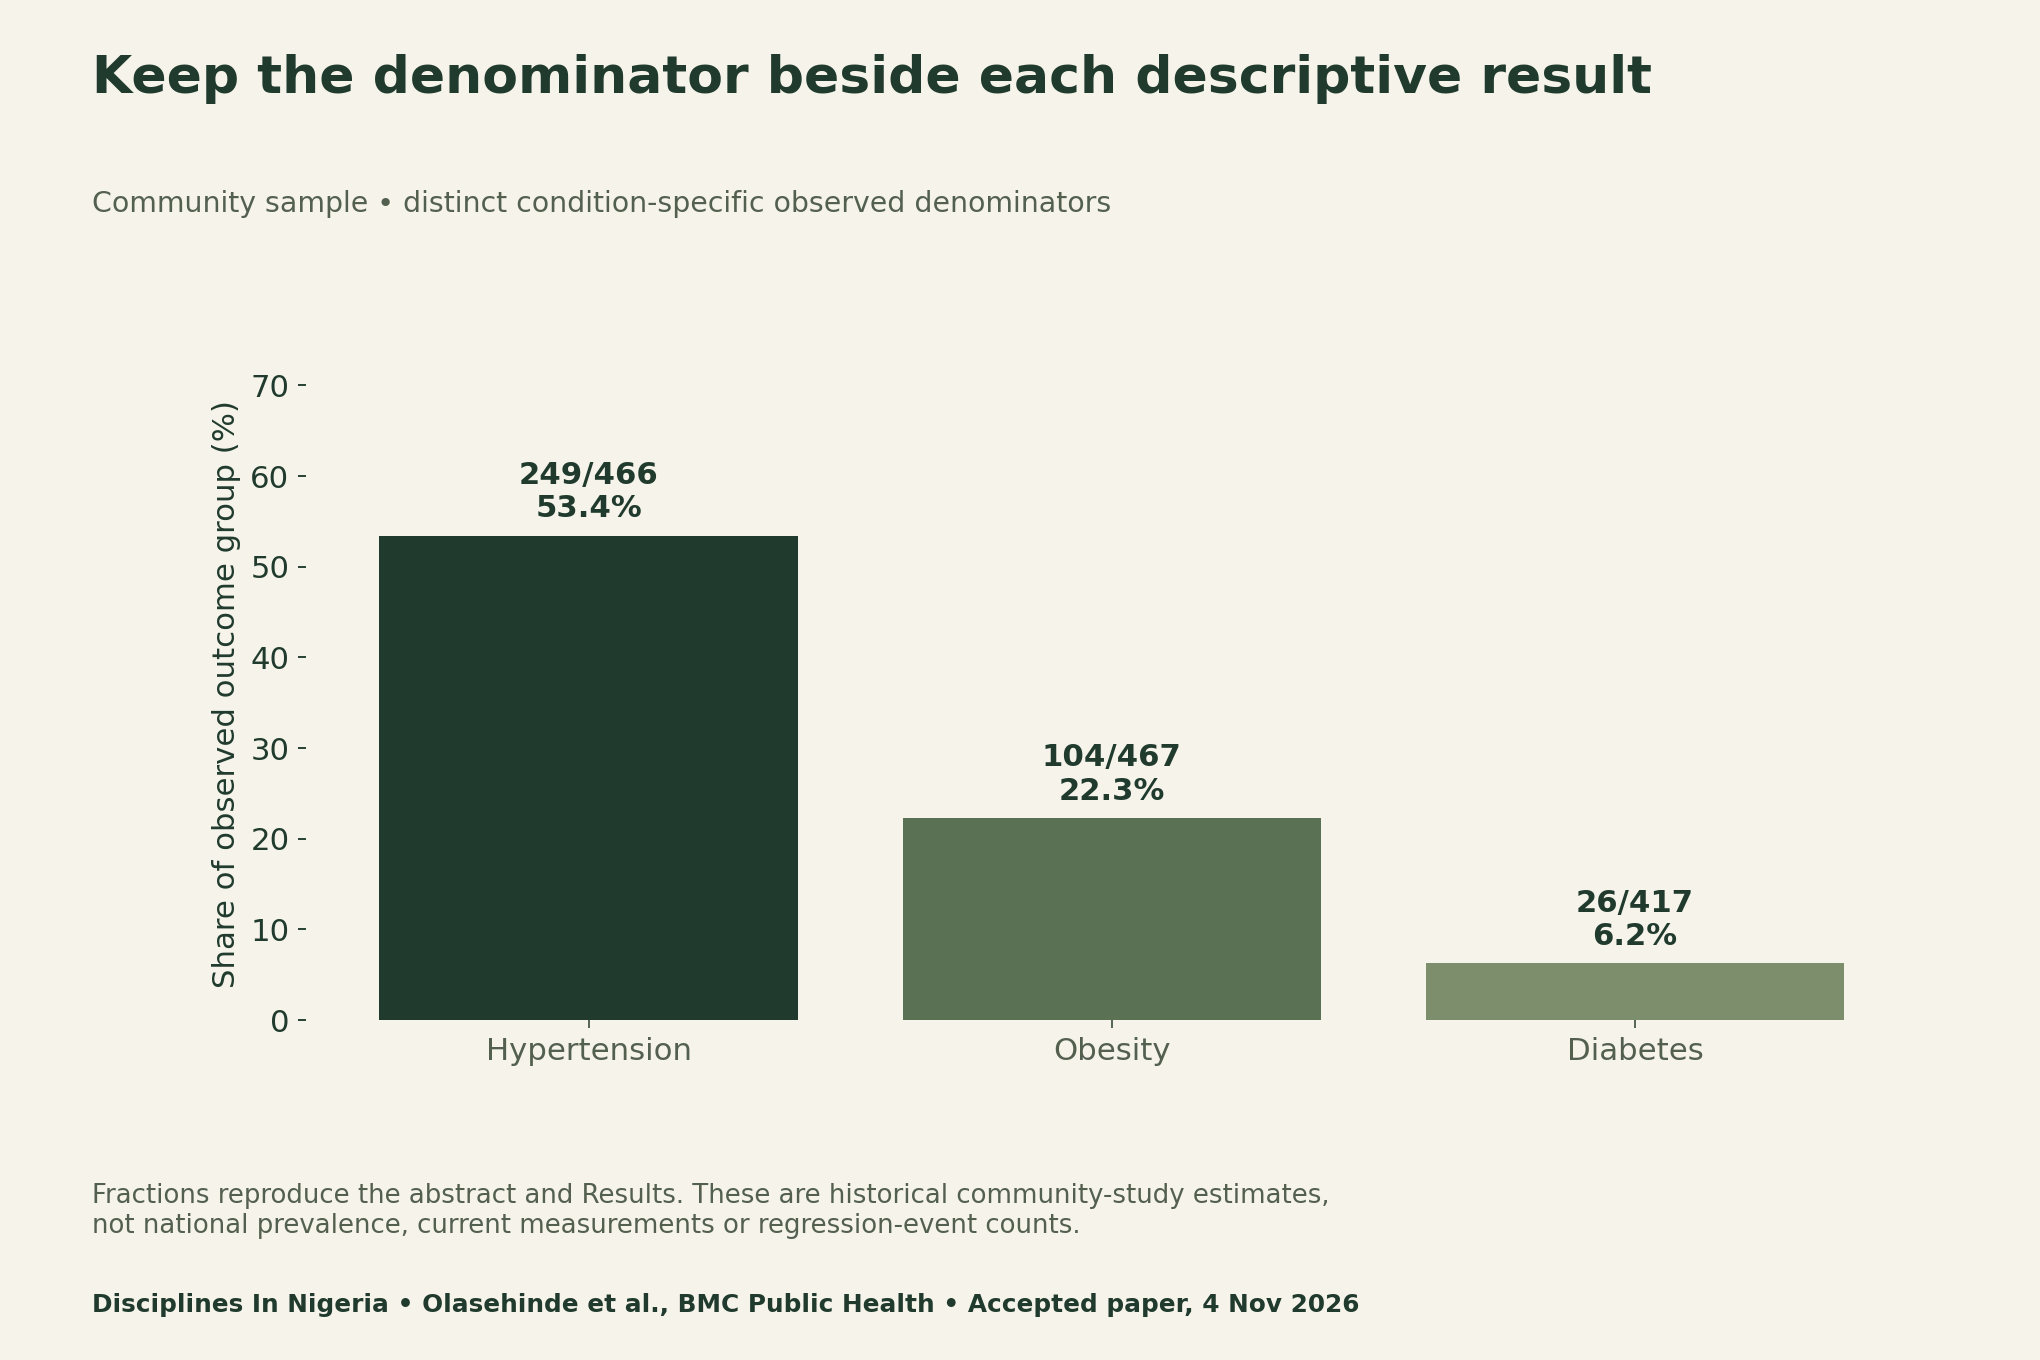
The abstract and Results report hypertension as 249/466 (53.4%), obesity as 104/467 (22.3%) and diabetes as 26/417 (6.2%). These fractions use different observed outcome groups. They should not be recalculated with 504 simply because that is the total recruited sample.
Audit public health missing data and conflicting labels
On accepted-PDF page 7, Table 2 prints n=467 beside diabetes and n=417 beside obesity. Those labels differ from the abstract, Results and the arithmetic of the displayed percentages. Our ledger follows the explicitly stated fractions above and records the conflicting table labels. It does not silently harmonise the source or claim an author-issued correction.
This is a useful extraction rule: if a label, count and percentage disagree, preserve all three and their locations. State which representation your calculation uses and why. If a decision requires an unambiguous corrected dataset, seek clarification. A reporting conflict alone does not establish misconduct or invalidate every study result.
Follow the hypertension sample into the complete-case model
The hypertension model used 388 participants, with 198 events and 25 estimated parameters. The arithmetic is 504−388=116, or 23.0% of the recruited sample excluded from that analysis. This is analytic exclusion in a cross-sectional study, not longitudinal dropout.
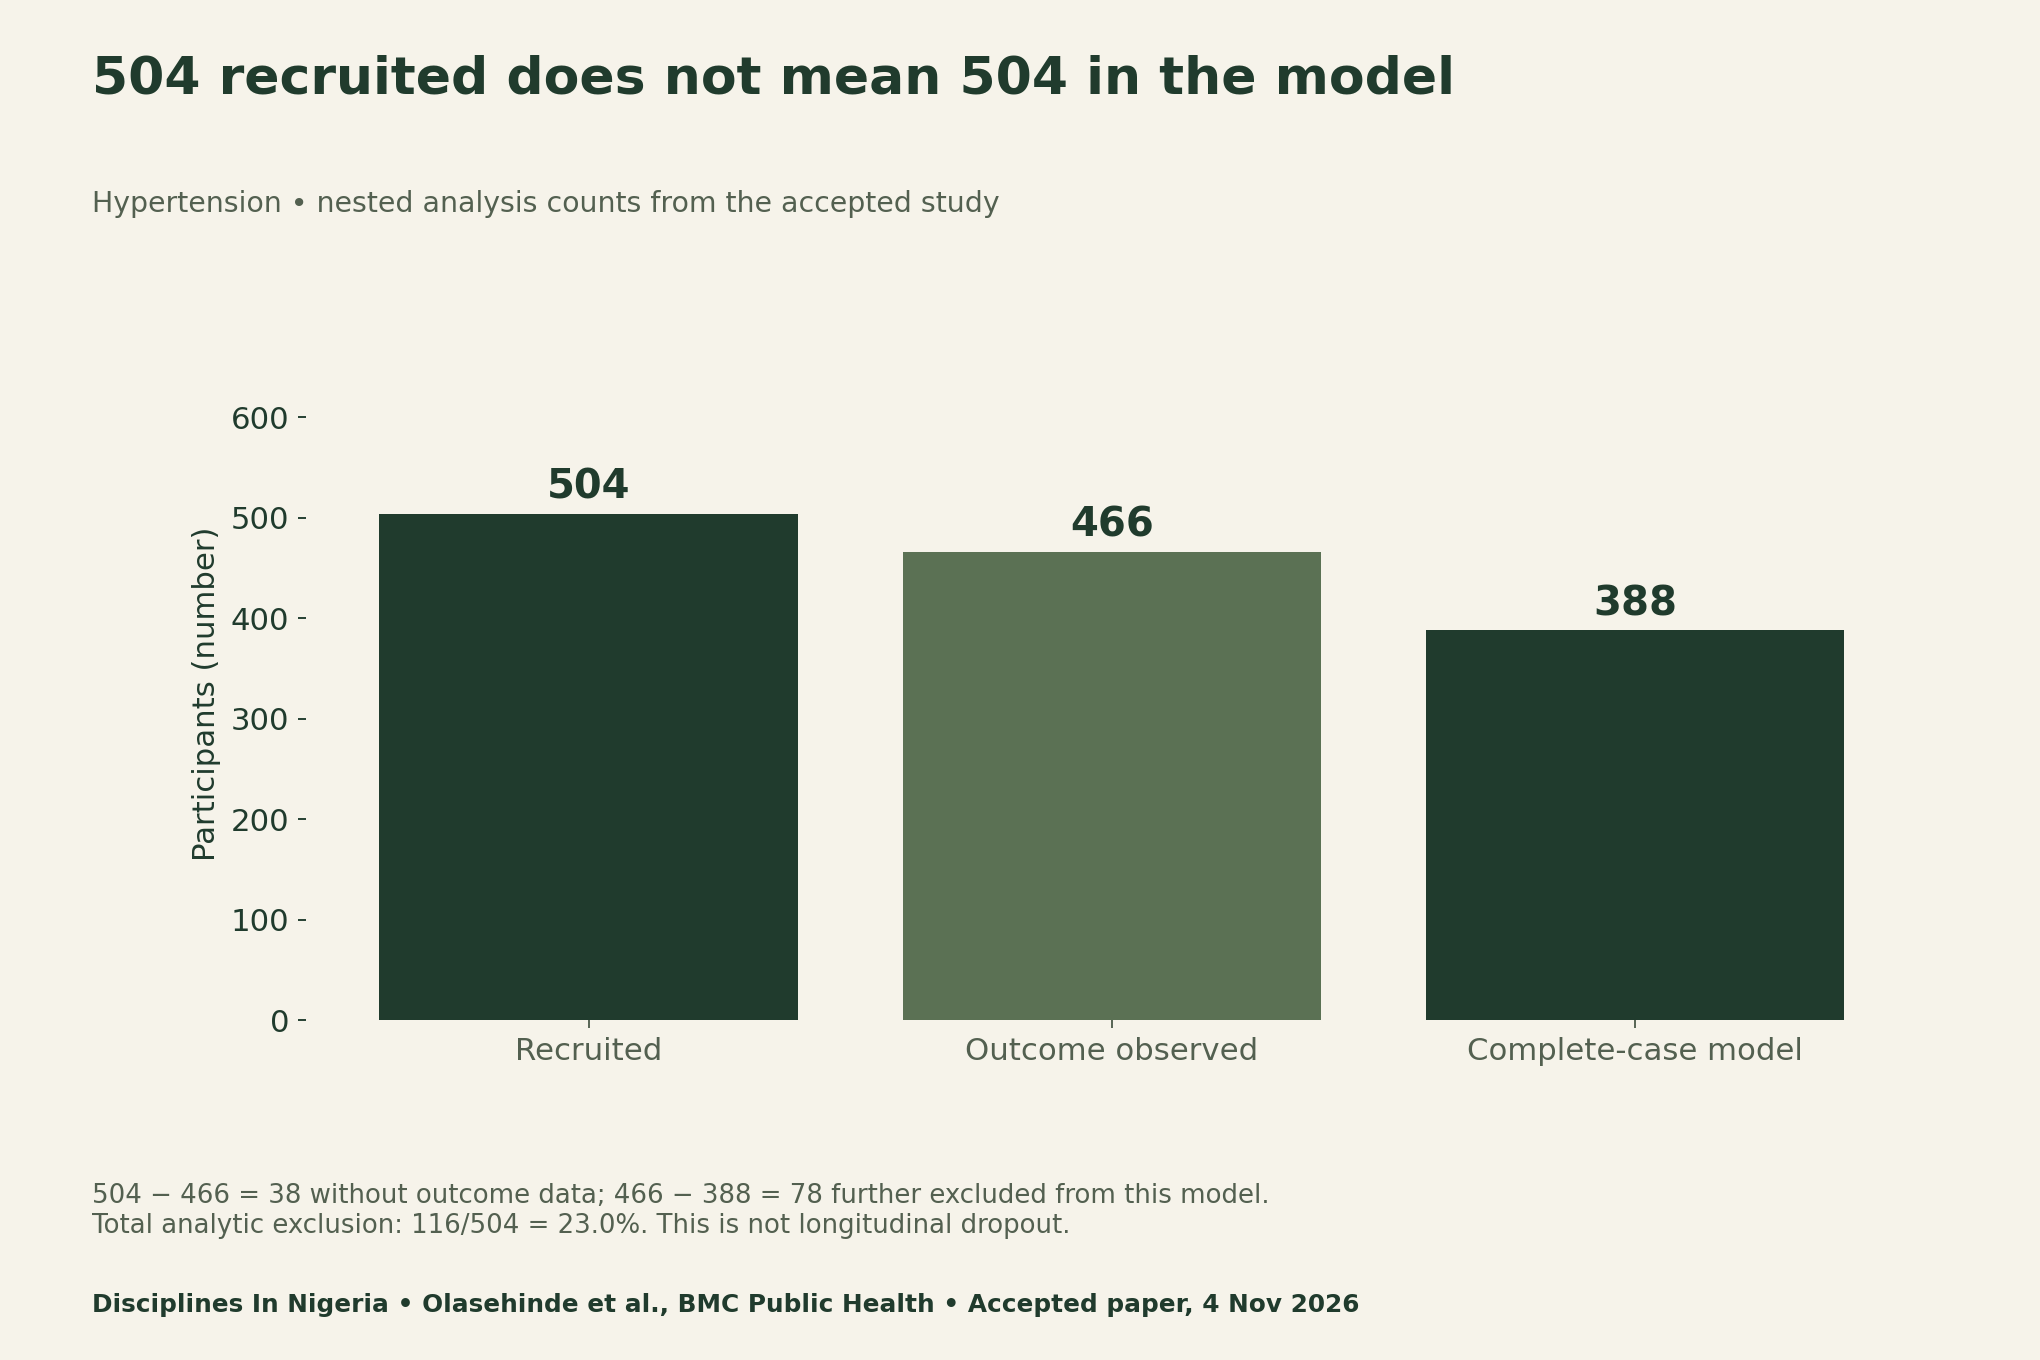
A model can require an outcome plus several covariates. A participant with an observed outcome may therefore still be absent from that model. Record each model’s eligibility rule and analysed sample separately. Do not assume all models in one paper use identical participants, even if their recruited sample is shared.
Do not add overlapping variable-level missing counts
The model description reports missing counts of 38 for the hypertension outcome, 56 for family history, 41 for employment type and 2 for cooking fuel. Those counts sum to 137 variable-level missing entries. They are not 137 distinct people: one participant can have more than one missing variable.
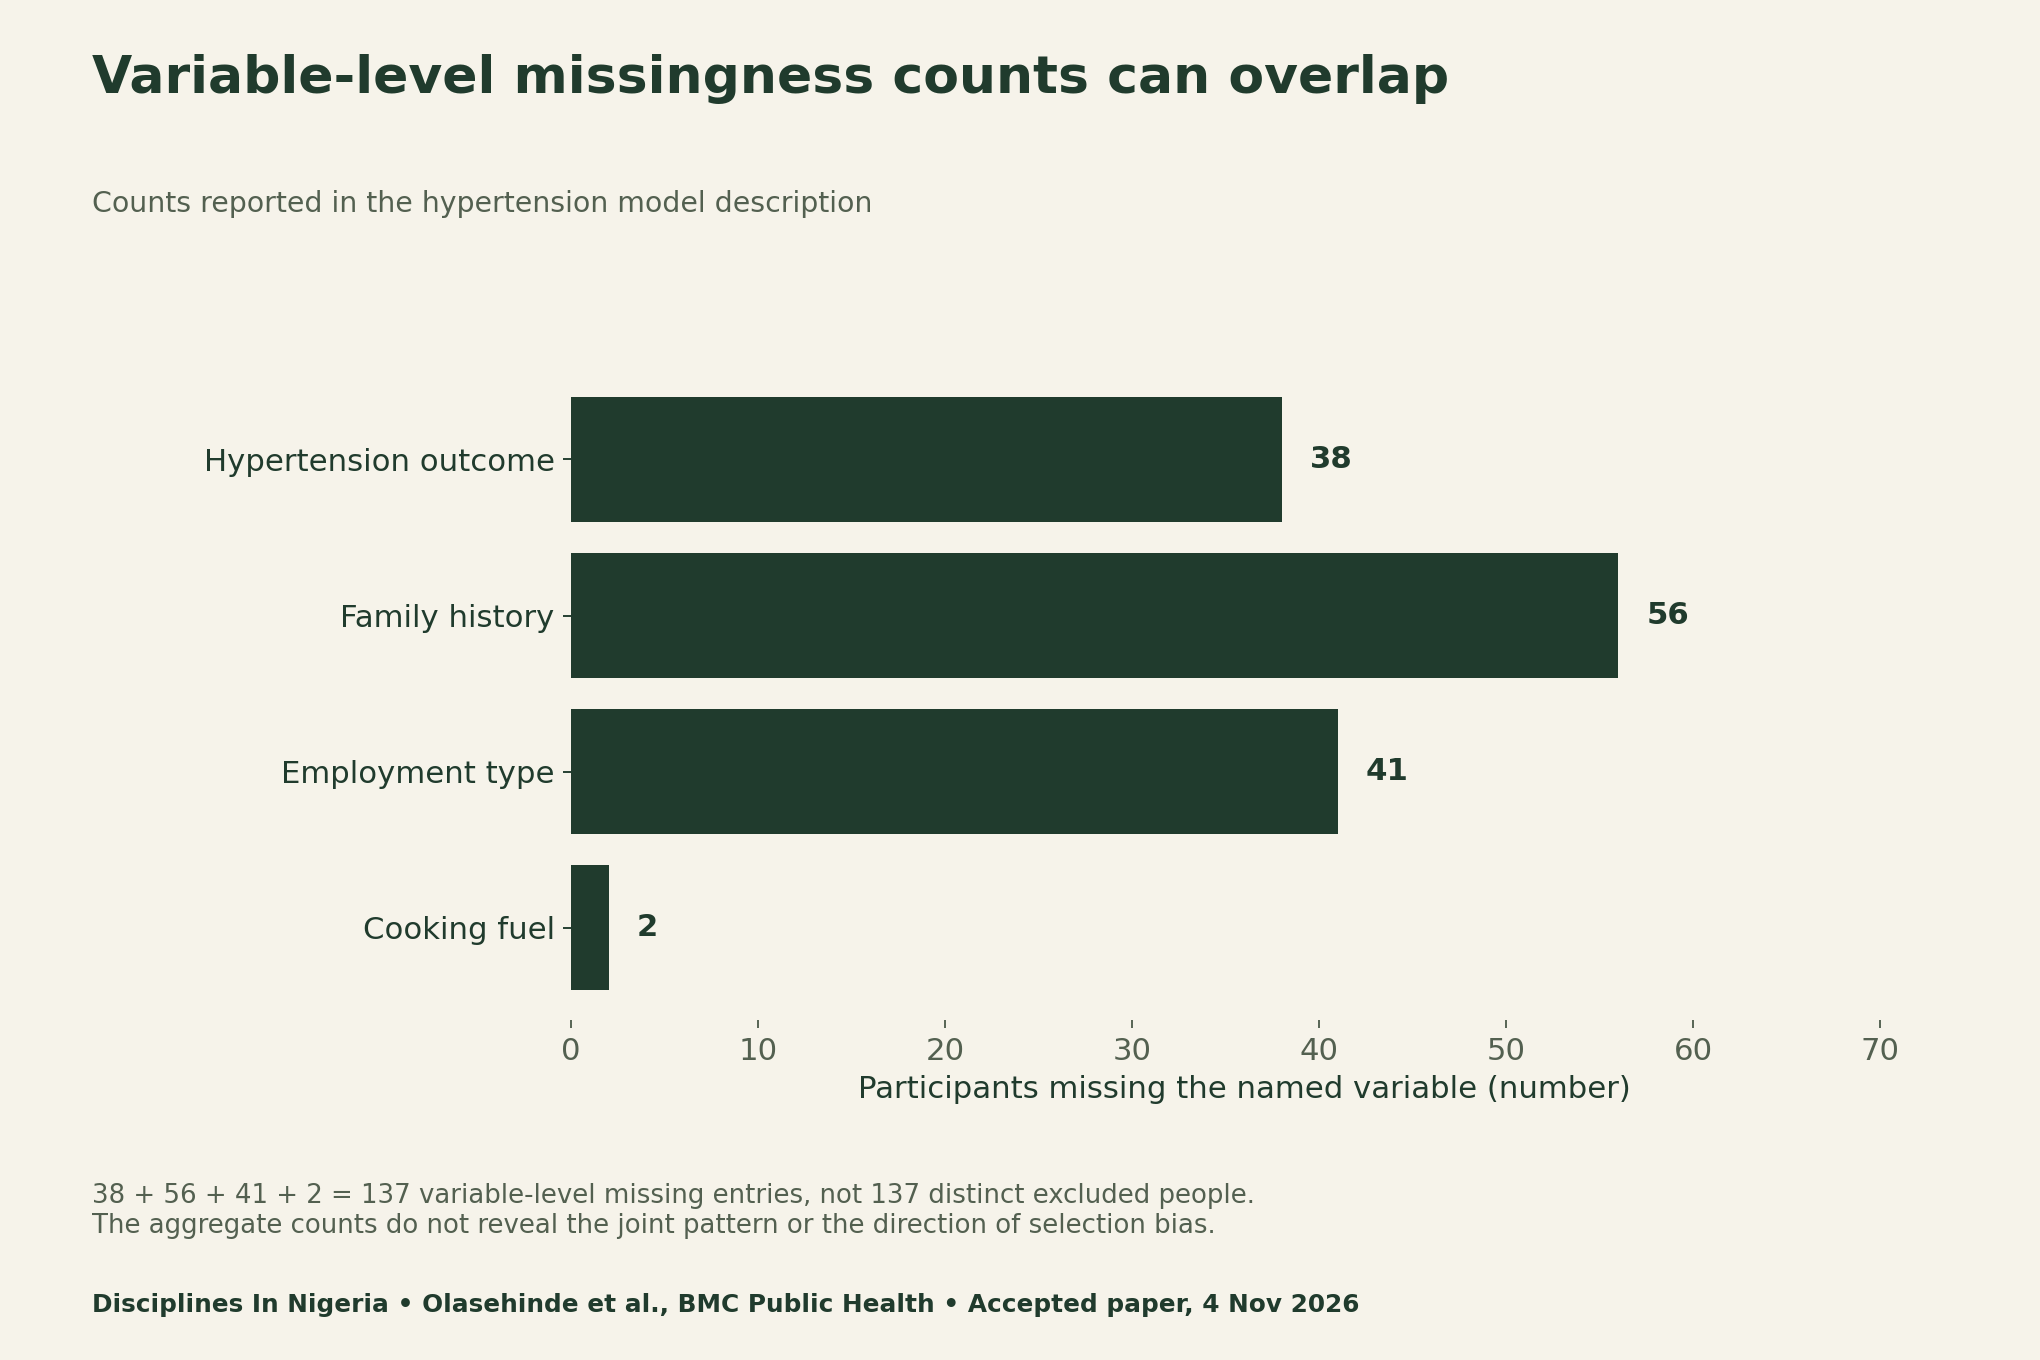
For a new study, a missingness table should distinguish variable-level counts from joint patterns. Keep “not measured,” “not applicable,” “declined” and other valid routing categories separate where the design supports them. A blank cell is not automatically a zero or evidence that a condition was absent.
Keep events, parameters and uncertainty attached to the model
Dividing 198 events by 25 parameters gives 7.92, matching the paper’s rounded 7.9. That ratio supplies context for model complexity; it is not a universal pass/fail test. The authors also note imprecision and unadjusted multiple comparisons. Those limitations remain relevant when a single association appears statistically notable.
The descriptive diabetes count is 26, while the model description reports 25 events. Retain the distinction between summaries rather than substituting one count into the other analysis. Without record-level data, this audit cannot identify which observation or coding decision accounts for the difference.
A model’s sample size, number of events and number of parameters answer different questions. More predictors can require more than one parameter when categories are expanded. A precise audit therefore records estimated parameters rather than merely counting variable names. Do not diagnose an invalid model from one ratio alone.
Plan public health analysis for missing data
The STROBE cross-sectional reporting checklist asks authors to explain how missing data were addressed, report participant numbers at analysis stages, identify missing counts by variable and describe sensitivity analyses. Use it to organize reporting questions, not as a numerical study-quality score.
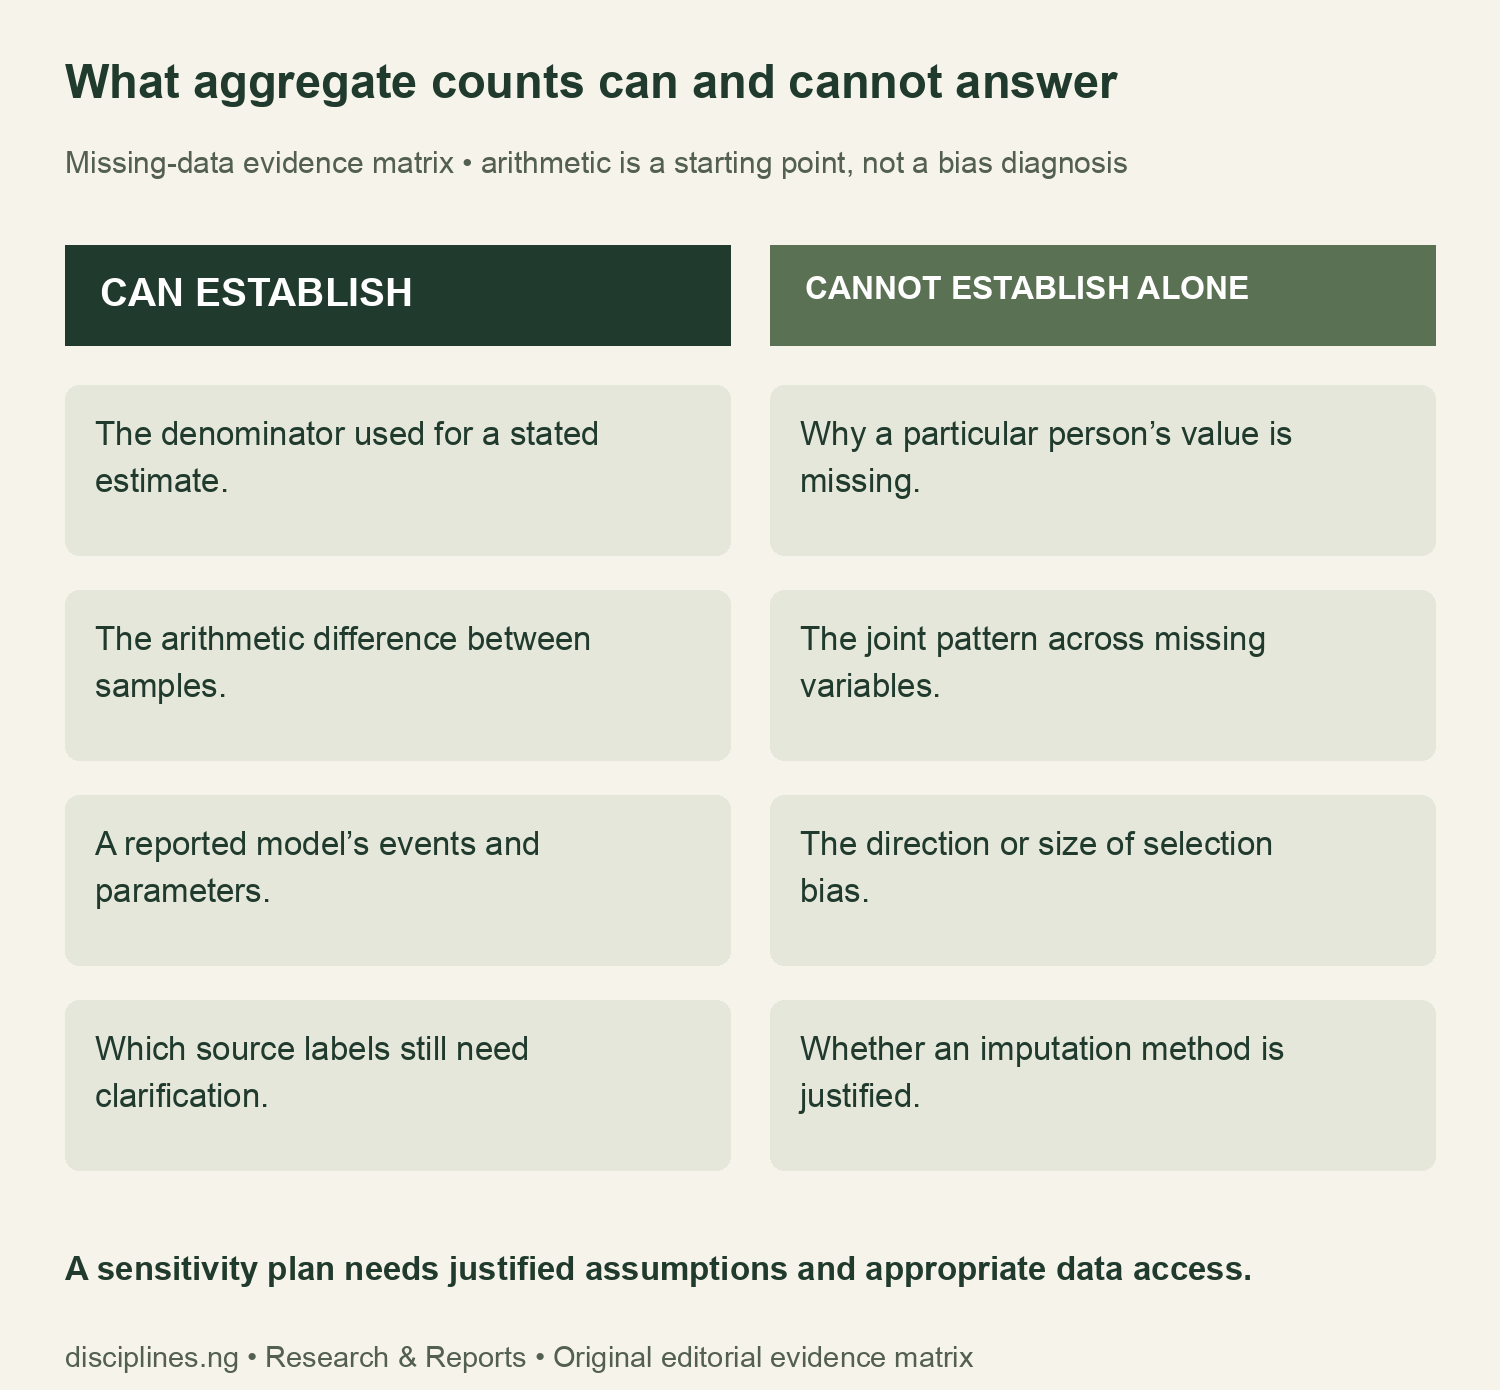
Our blank protocol starts with variable definitions, collection routing, missing counts and reasons where known. It then asks for comparisons between included and excluded records using available information, a primary analysis rule and justified assumptions. A sensitivity plan should address a clear question about how conclusions might change under plausible alternatives.
No single remedy follows automatically from seeing 23.0% analytic exclusion. Choosing complete-case analysis, imputation or another approach requires a suitable statistical rationale and data access. We do not classify the missingness mechanism, fill blank observations or claim that an alternative method would reverse the paper’s conclusions.
Keep sensitive records in approved systems with appropriate consent and access controls. Public worksheets should contain design decisions and aggregate summaries only. Do not upload identifiable health histories, household locations or participant identifiers to these blank tools. Their purpose is planning and source checking, not collecting patient records.
Our insurance survey-date audit separates fieldwork, policy and publication clocks. The pharmacy-student denominator guide shows how one numerator can answer different questions when its denominator changes.
Download the denominator ledger and blank protocols
The source ledger retains numerator, denominator, stage and location. The flow file reproduces availability and exclusion arithmetic without inventing joint patterns. The two blank tools support a missingness-analysis plan and a source-version audit. Neither contains individual health data or a completed model refit.
- Ibadan denominator and model-source ledger (CSV)
- Missingness counts and sample-flow calculations (CSV)
- Blank missing-data analysis protocol (CSV)
- Blank denominator and source-conflict audit (CSV)
Methods, limitations and citation
For this guide to missing data in Nigerian public health research, we inspected the publisher page and accepted PDF, checked the printed table visually, transcribed selected aggregate counts and retained conflicting labels. Percentages use count divided by the stated denominator. Differences use subtraction; events per parameter use 198 divided by 25. All charts and templates are original, with no publisher figure or questionnaire reproduced.
The audit cannot determine the magnitude or direction of missing-data bias, verify individual exclusions or make a clinical inference about a reader. It is not a national health estimate, a model validation or a misconduct assessment. The source is an early version. Recheck the version if using the unresolved labels in a later analysis.
Suggested citation: Disciplines In Nigeria (9 November 2026), “Missing Data in Nigerian Public Health Research: Audit the Denominator,” aggregate calculations and original planning tools. Cite Olasehinde and colleagues for the community study and retain its population, dates and version caveats.


