




Interpreting Ebola surveillance data in Nigeria starts with three questions: what is counted, when was it observed, and which population does it describe? A confirmed case, a contact record and a person under follow-up are different measures. Putting them together without those checks can produce a misleading headline.
This guide helps Nigerian public-health students, laboratory-science students and research communicators read dated updates. It is an academic measurement resource, not a live outbreak dashboard, diagnostic tool or treatment guide. Five figures and three CSV resources separate the reported evidence from our proposed teaching examples.
Evidence checked: 28 October 2026. The contact snapshot below refers to 25 October. We checked the later ECDC update dated 27 October, which retains that cutoff. A later publication date does not make the underlying count a new observation. Follow NCDC’s current information for public-health guidance.
Interpreting Ebola surveillance data in Nigeria: read both dates
The NCDC statement dated 25 October 2026 reports one confirmed case. Separately, ECDC’s 26 October update records 53 contacts under follow-up as of 25 October. ECDC attributes that figure to a Nigerian CDC media briefing. These are differently defined counts, not components of a percentage.
The 27 October ECDC update repeats the 53-contact figure with the same 25 October date. Therefore, we record both publications in the evidence ledger without adding their contact counts. The ledger documents provenance and repetition; it is not a series of independent daily observations.
| Publication | Observation label | Reported count |
|---|---|---|
| NCDC, 25 October | Confirmed case, by statement date | 1 |
| ECDC, 26 October | Contacts under follow-up at 25 October | 53 |
| ECDC, 27 October | Same 25 October contact snapshot | 53 |
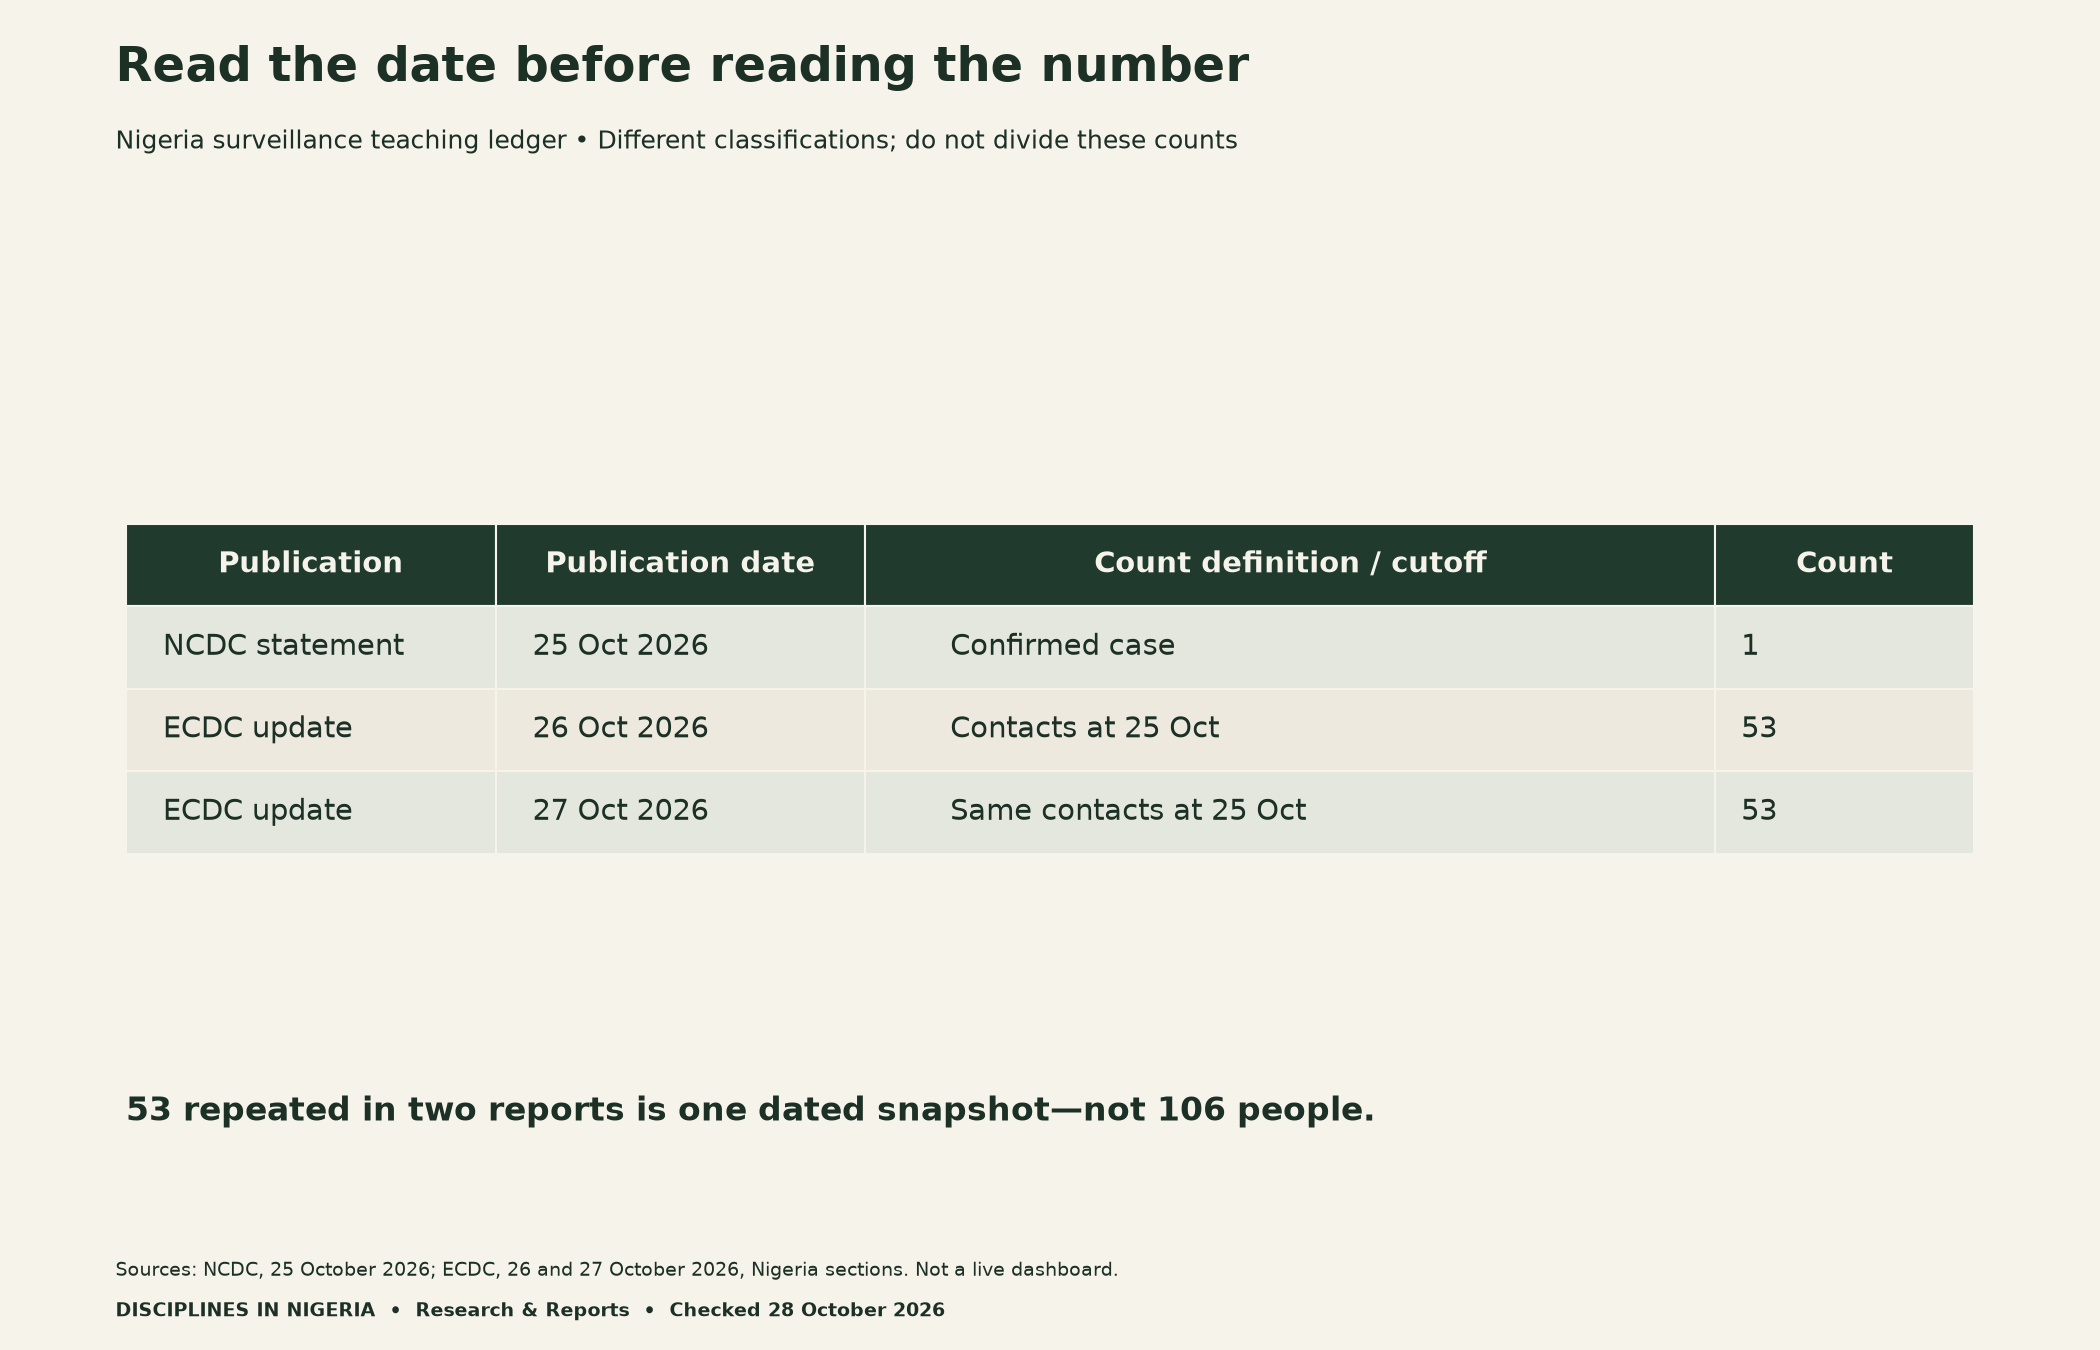
Keep a publication-date field and an observation-cutoff field in your notes. Add the source URL, geographic scope, classification and revision note. If a date is unavailable, write “not specified” rather than borrowing the webpage’s update time. That missing field should remain visible to the next reader.
Cases and contacts answer different questions
NCDC explains that identifying someone as a contact does not establish that the person has Ebola. Investigation can also change the number of identified contacts. Its statement describes follow-up for 21 days from the last possible exposure. Those distinctions are central to accurate interpretation, rather than minor footnotes.
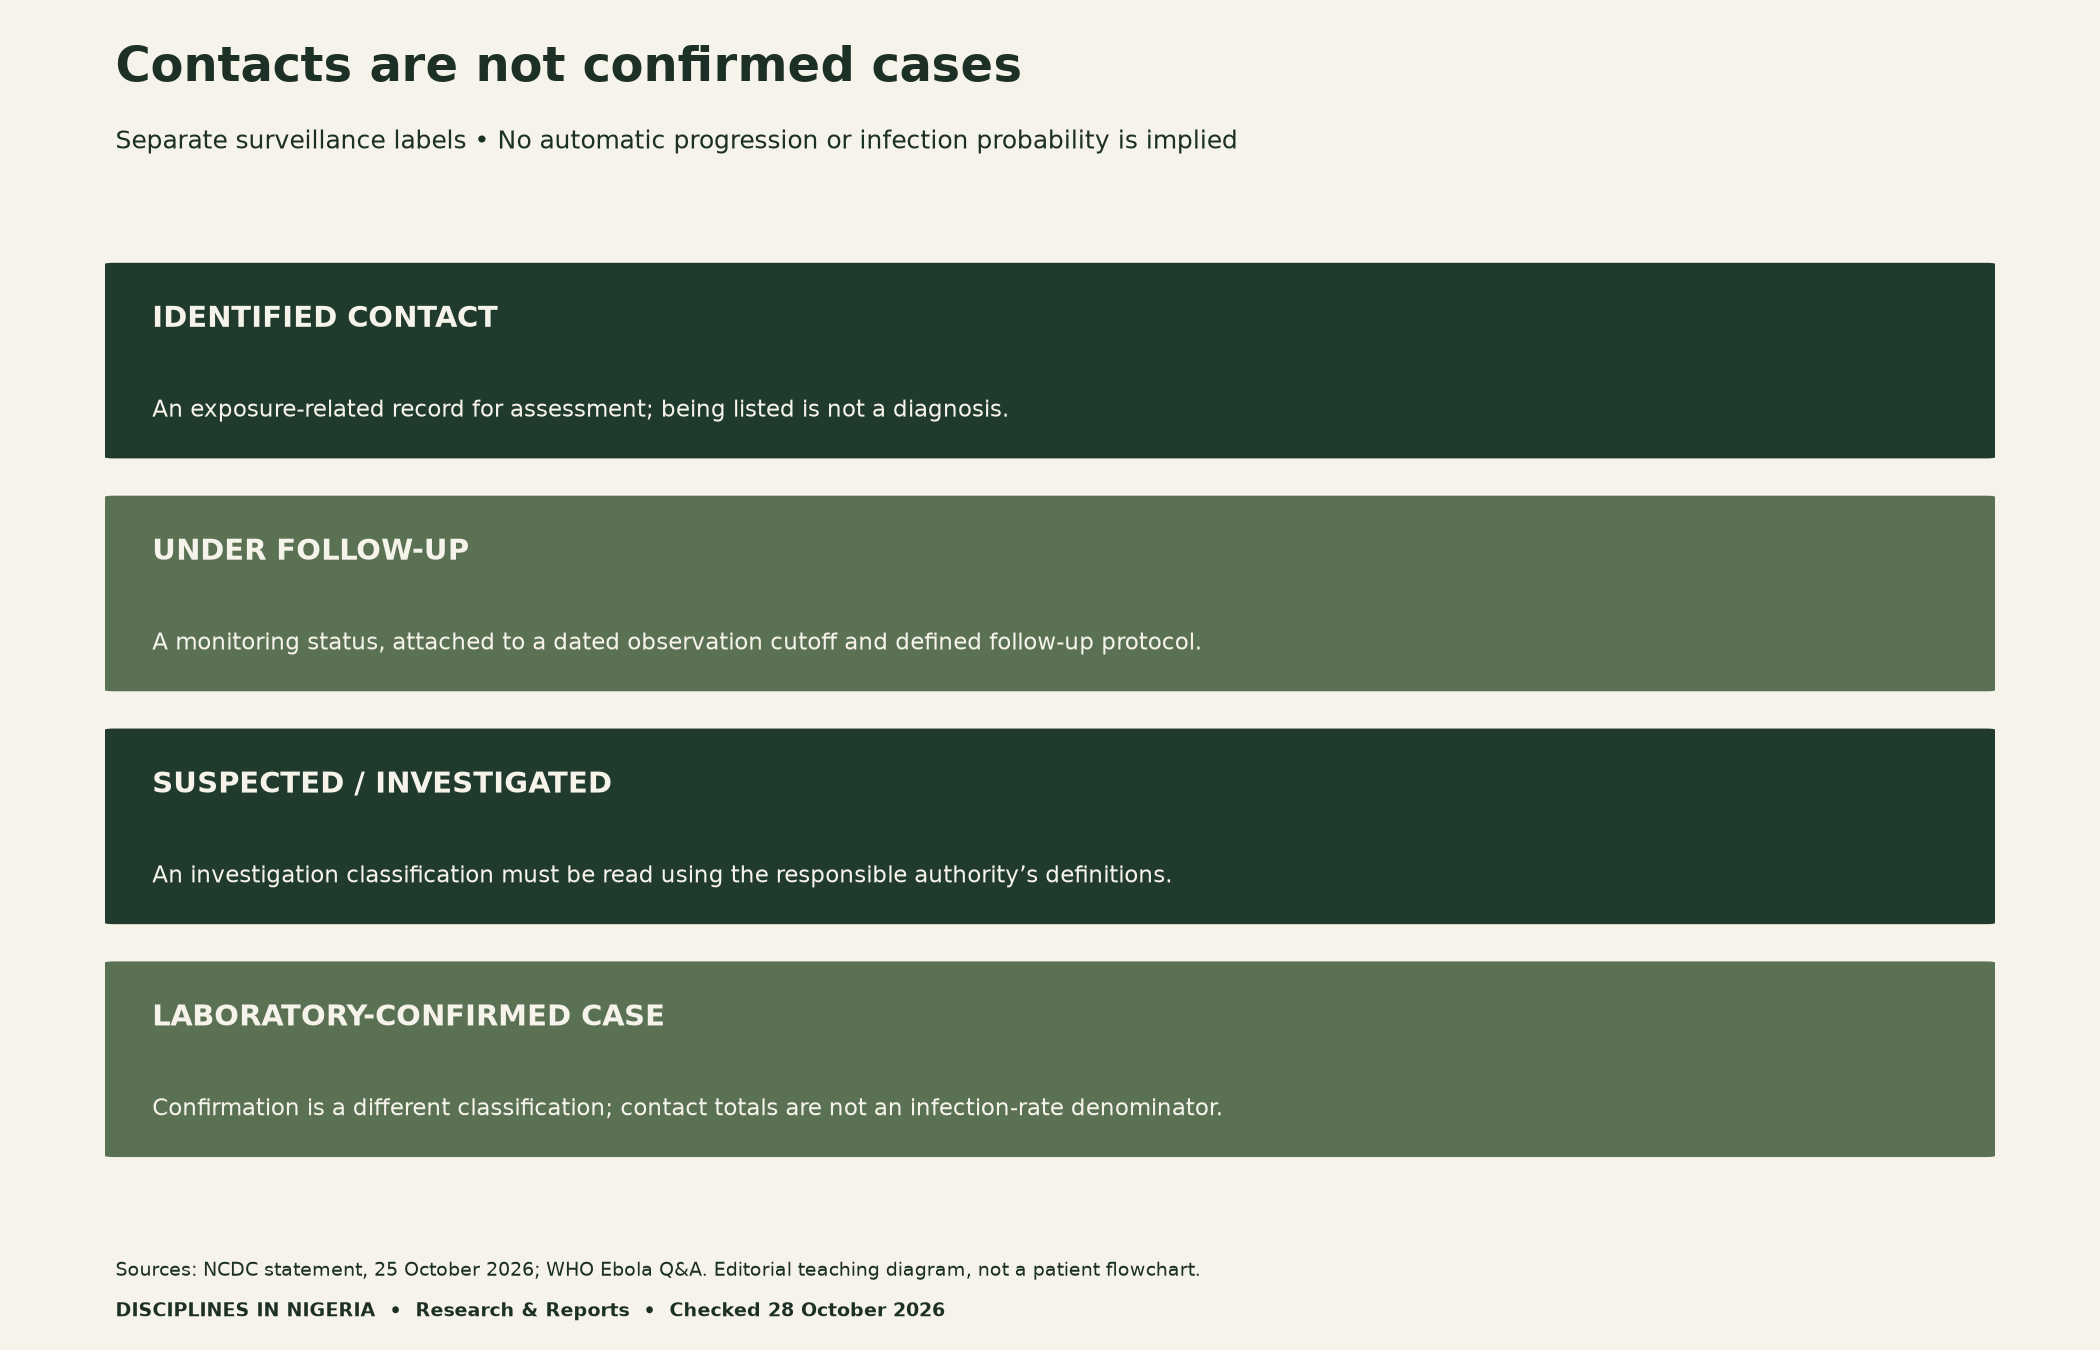
The WHO Ebola questions and answers describes contact monitoring and the role of laboratory confirmation. For our analytical purpose, the key lesson is that a monitoring label is not a diagnosis. Do not infer a person’s test result from their presence in a follow-up count.
In a research table, preserve the category used by the source. Avoid quietly replacing “contacts under follow-up” with “infections” or “suspected cases.” Likewise, do not combine an exposure-related register with confirmed-case totals merely because both columns count people. Their definitions and relationships need verification first.
Follow-up needs a time origin and complete observation
A follow-up duration is not a countdown that starts when a journalist publishes an article. It is attached to an individual’s exposure history and the responsible team’s assessment. Our diagram separates exposure, identification and the date at which a report describes monitoring.
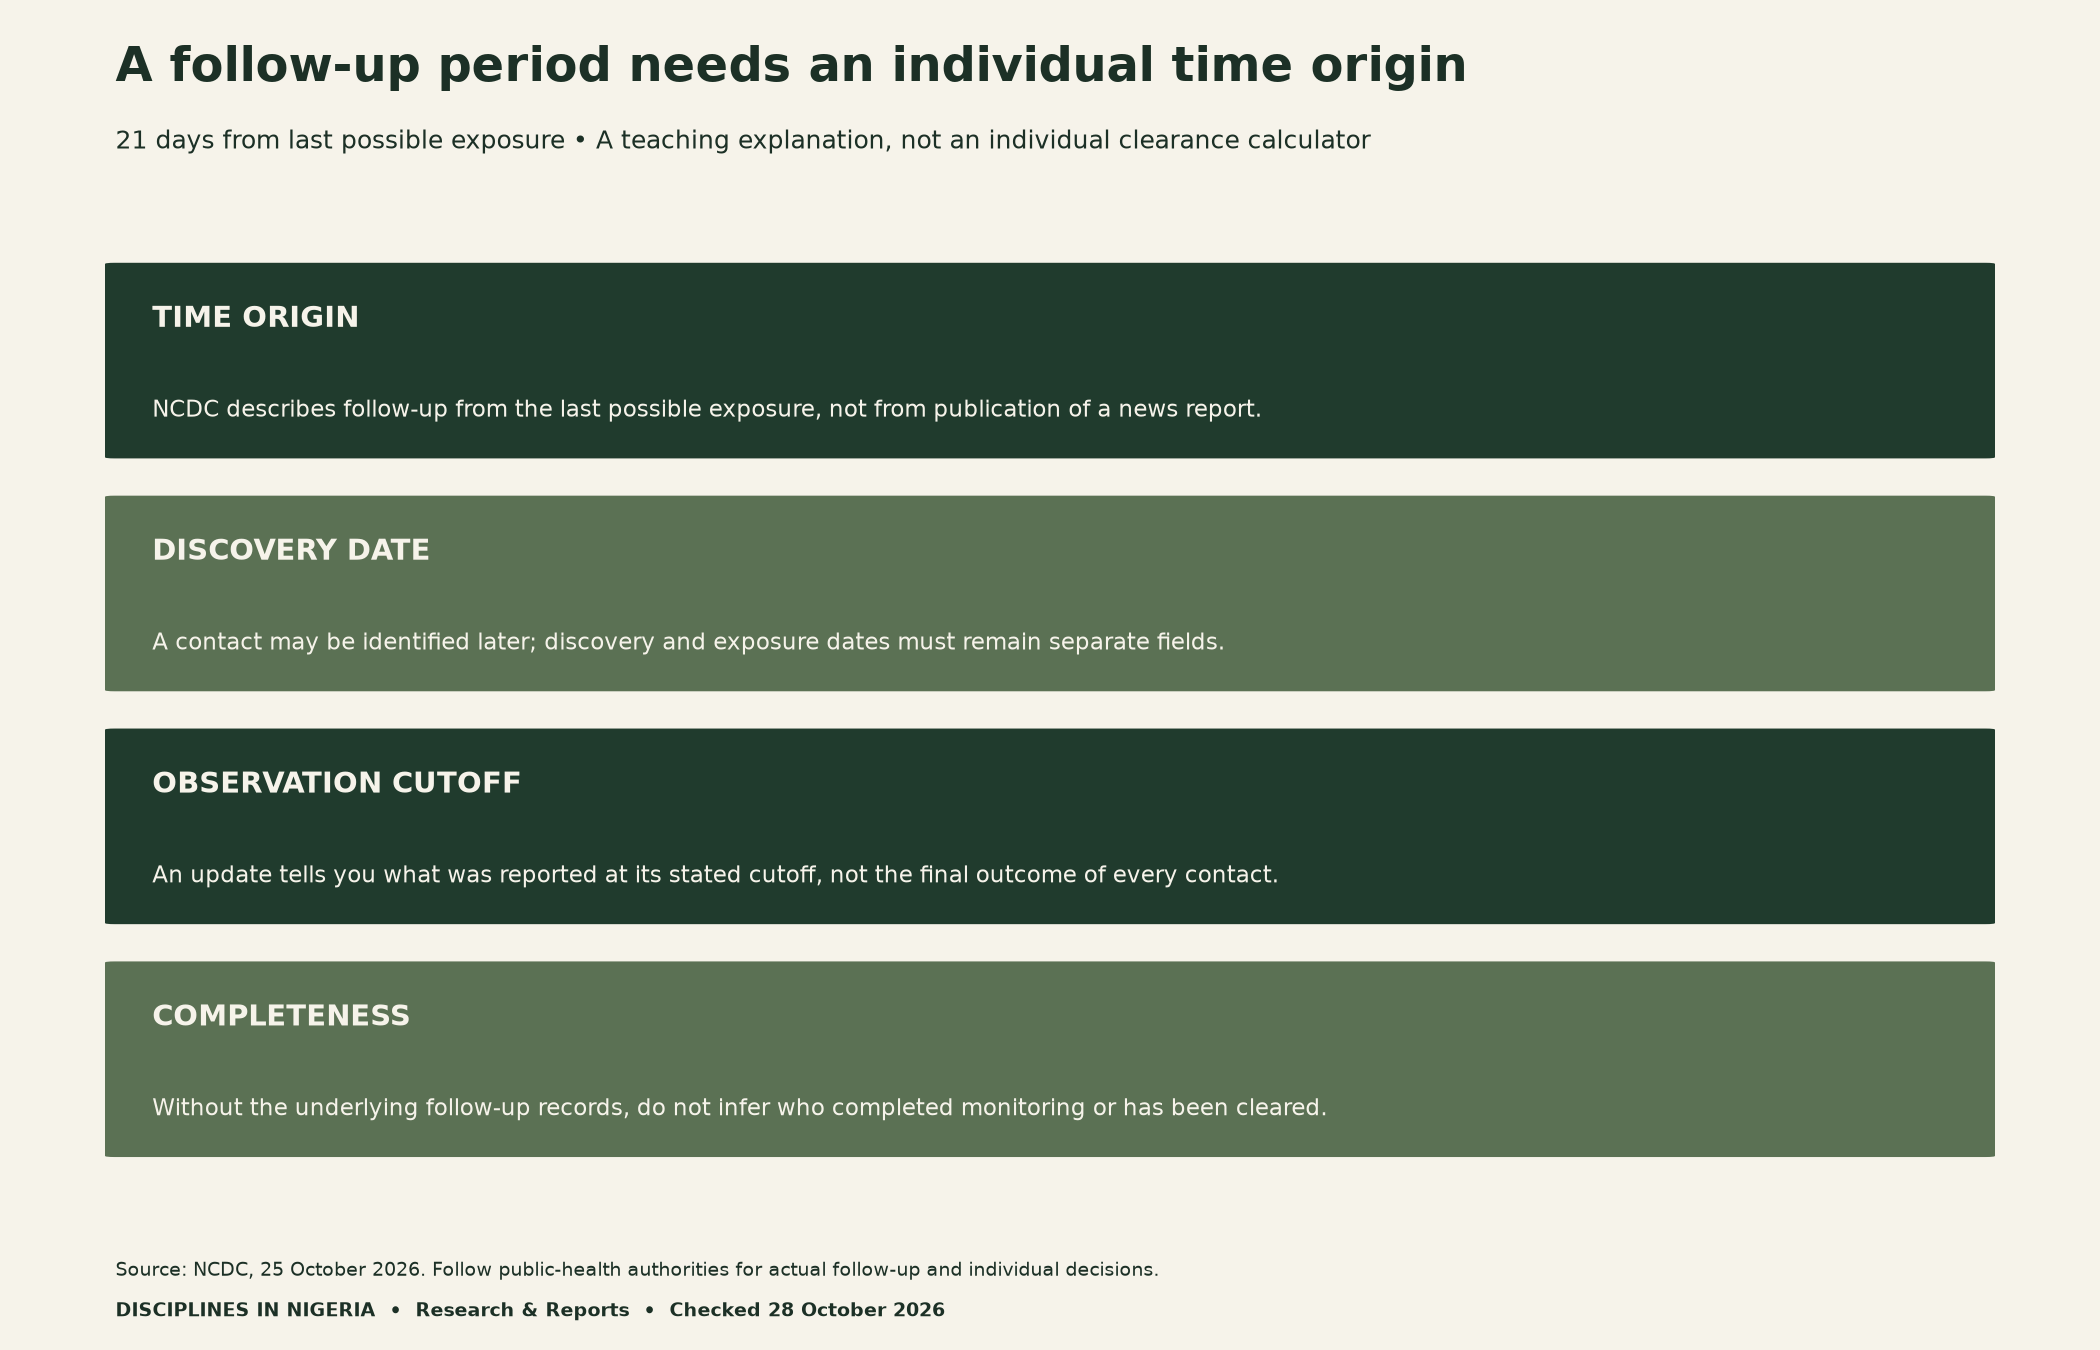
Without the underlying records, we cannot establish how many people completed follow-up, how much observation time each contributed, or whether everyone was reached at a given cutoff. An aggregate total does not reveal those details. Mark them as unknown rather than treating incomplete observation as a final outcome.
Also distinguish a stock from a flow. A count of people under monitoring at a cutoff is a snapshot. Newly identified records during a stated interval are an interval measure. You need documented entry, exit and revision information before reconciling those measures across reporting dates.

A fictional workload example for the classroom
Every number in this example is hypothetical. Imagine a teaching register with eight fictional contact records. A later classroom exercise identifies three additional fictional records. The arithmetic is 8 + 3 = 11 records. No diagnosis or test result has been assigned to any record.
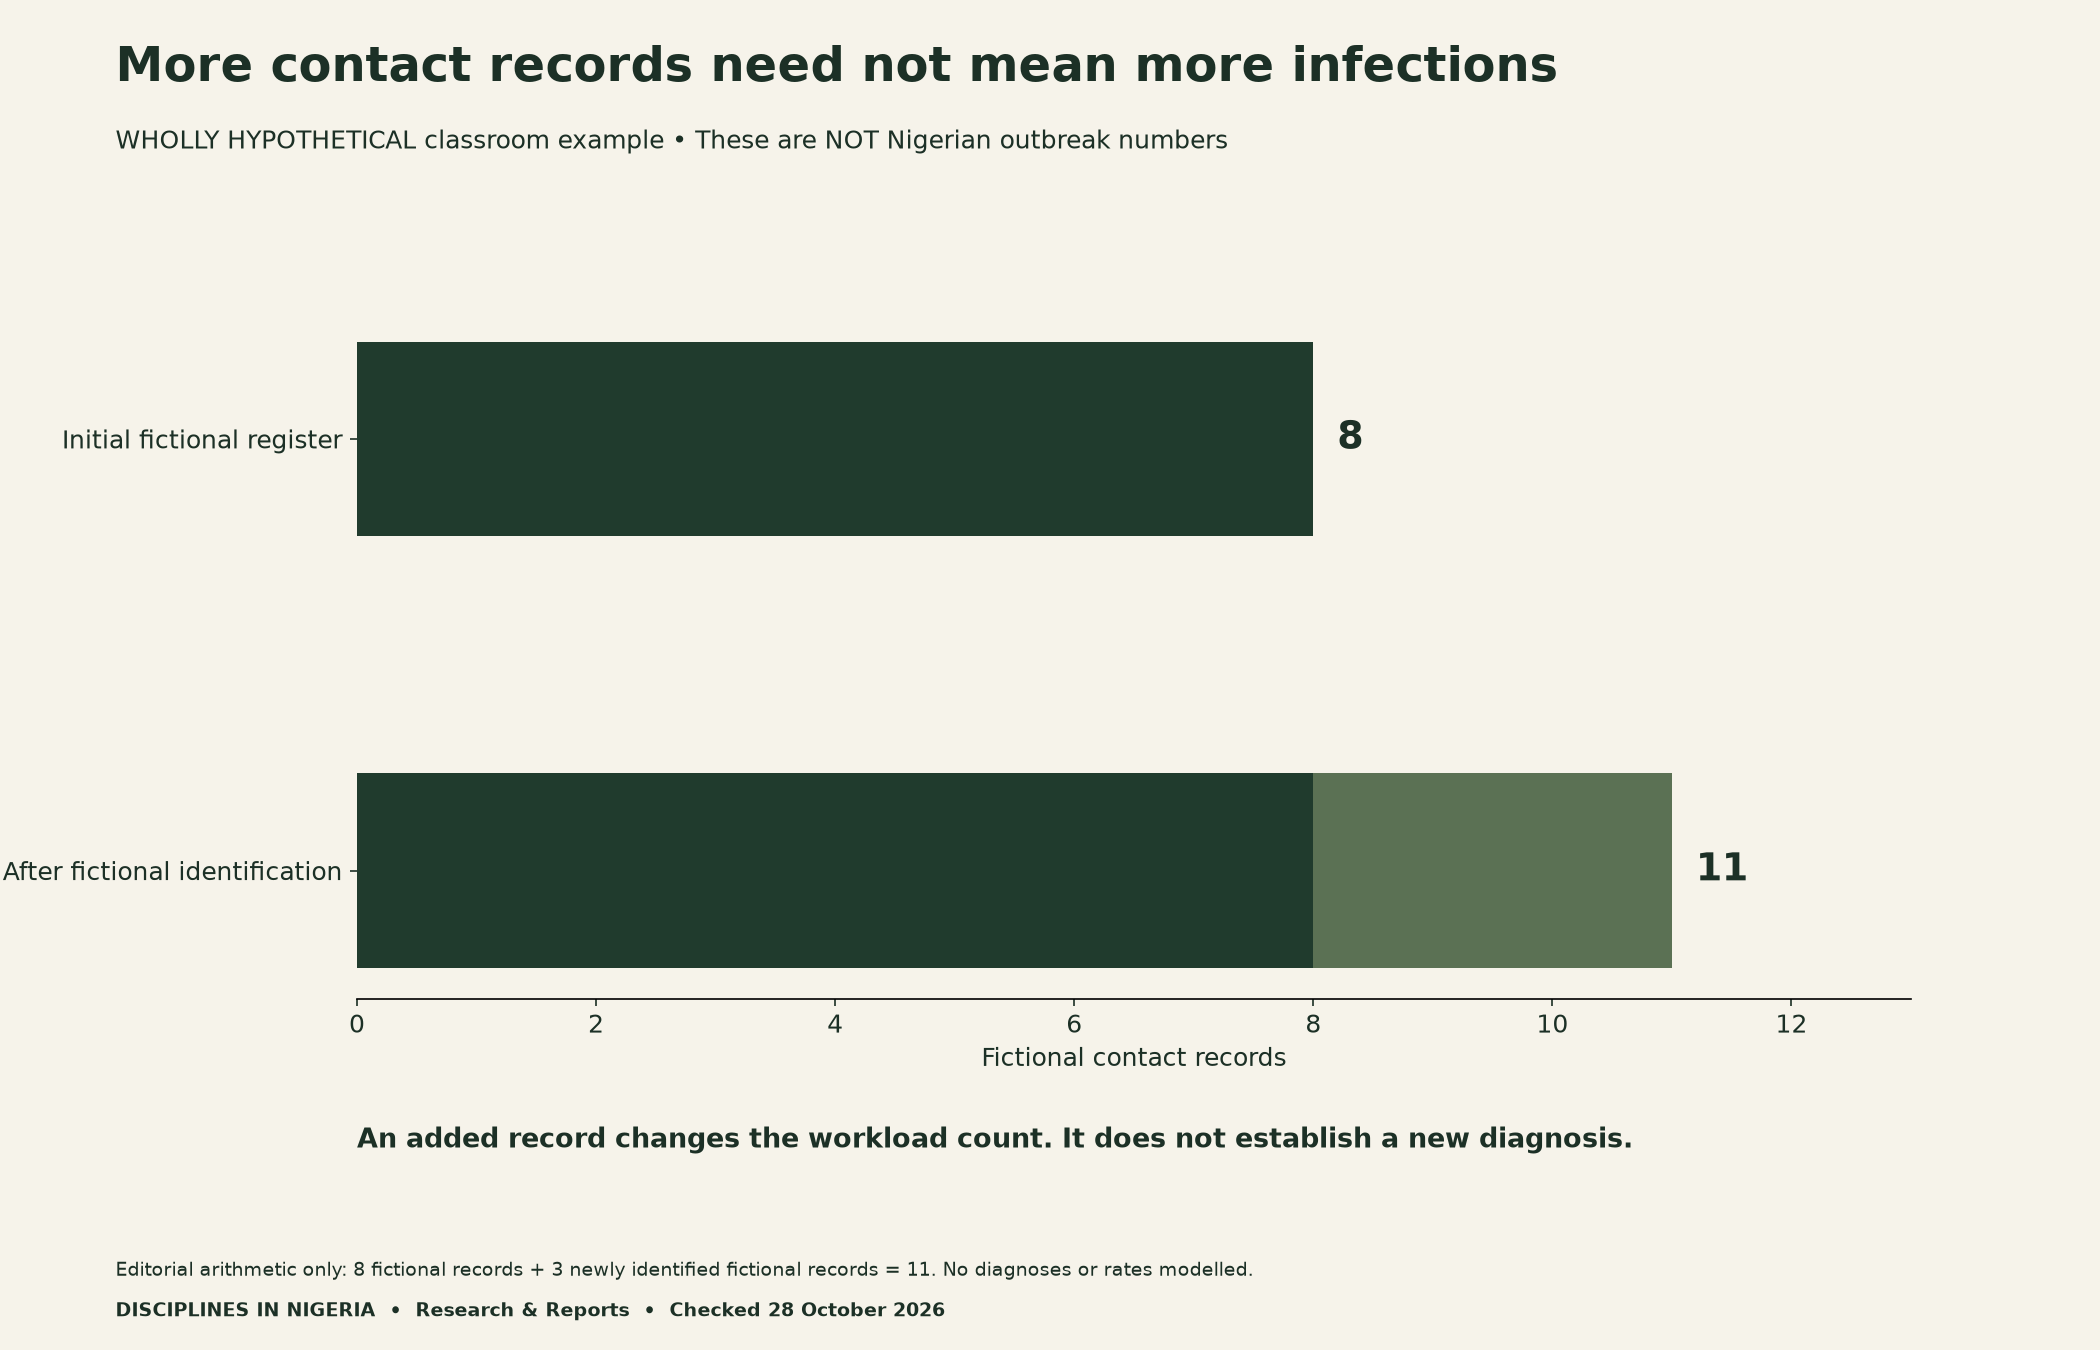
The exercise demonstrates why a change in identification can alter a workload count. It does not estimate Nigeria’s actual workload, contact risk or transmission. Do not combine these invented values with the official ledger. Keep their separate CSV file and conspicuous fictional label when using them in a seminar.
A useful discussion question is what additional information a researcher would need to explain a real register change. Possible requirements include defined reporting periods, consistent inclusion rules and documented revisions. That is a request for evidence, not an assertion that a particular revision occurred in this response.
Check the denominator before making an infection-rate claim
Dividing one confirmed case by 53 contacts does not establish an infection rate here. The numerator’s membership in that denominator, their shared observation period and follow-up completeness have not been established for that calculation. A mathematically executable division can still answer the wrong scientific question.
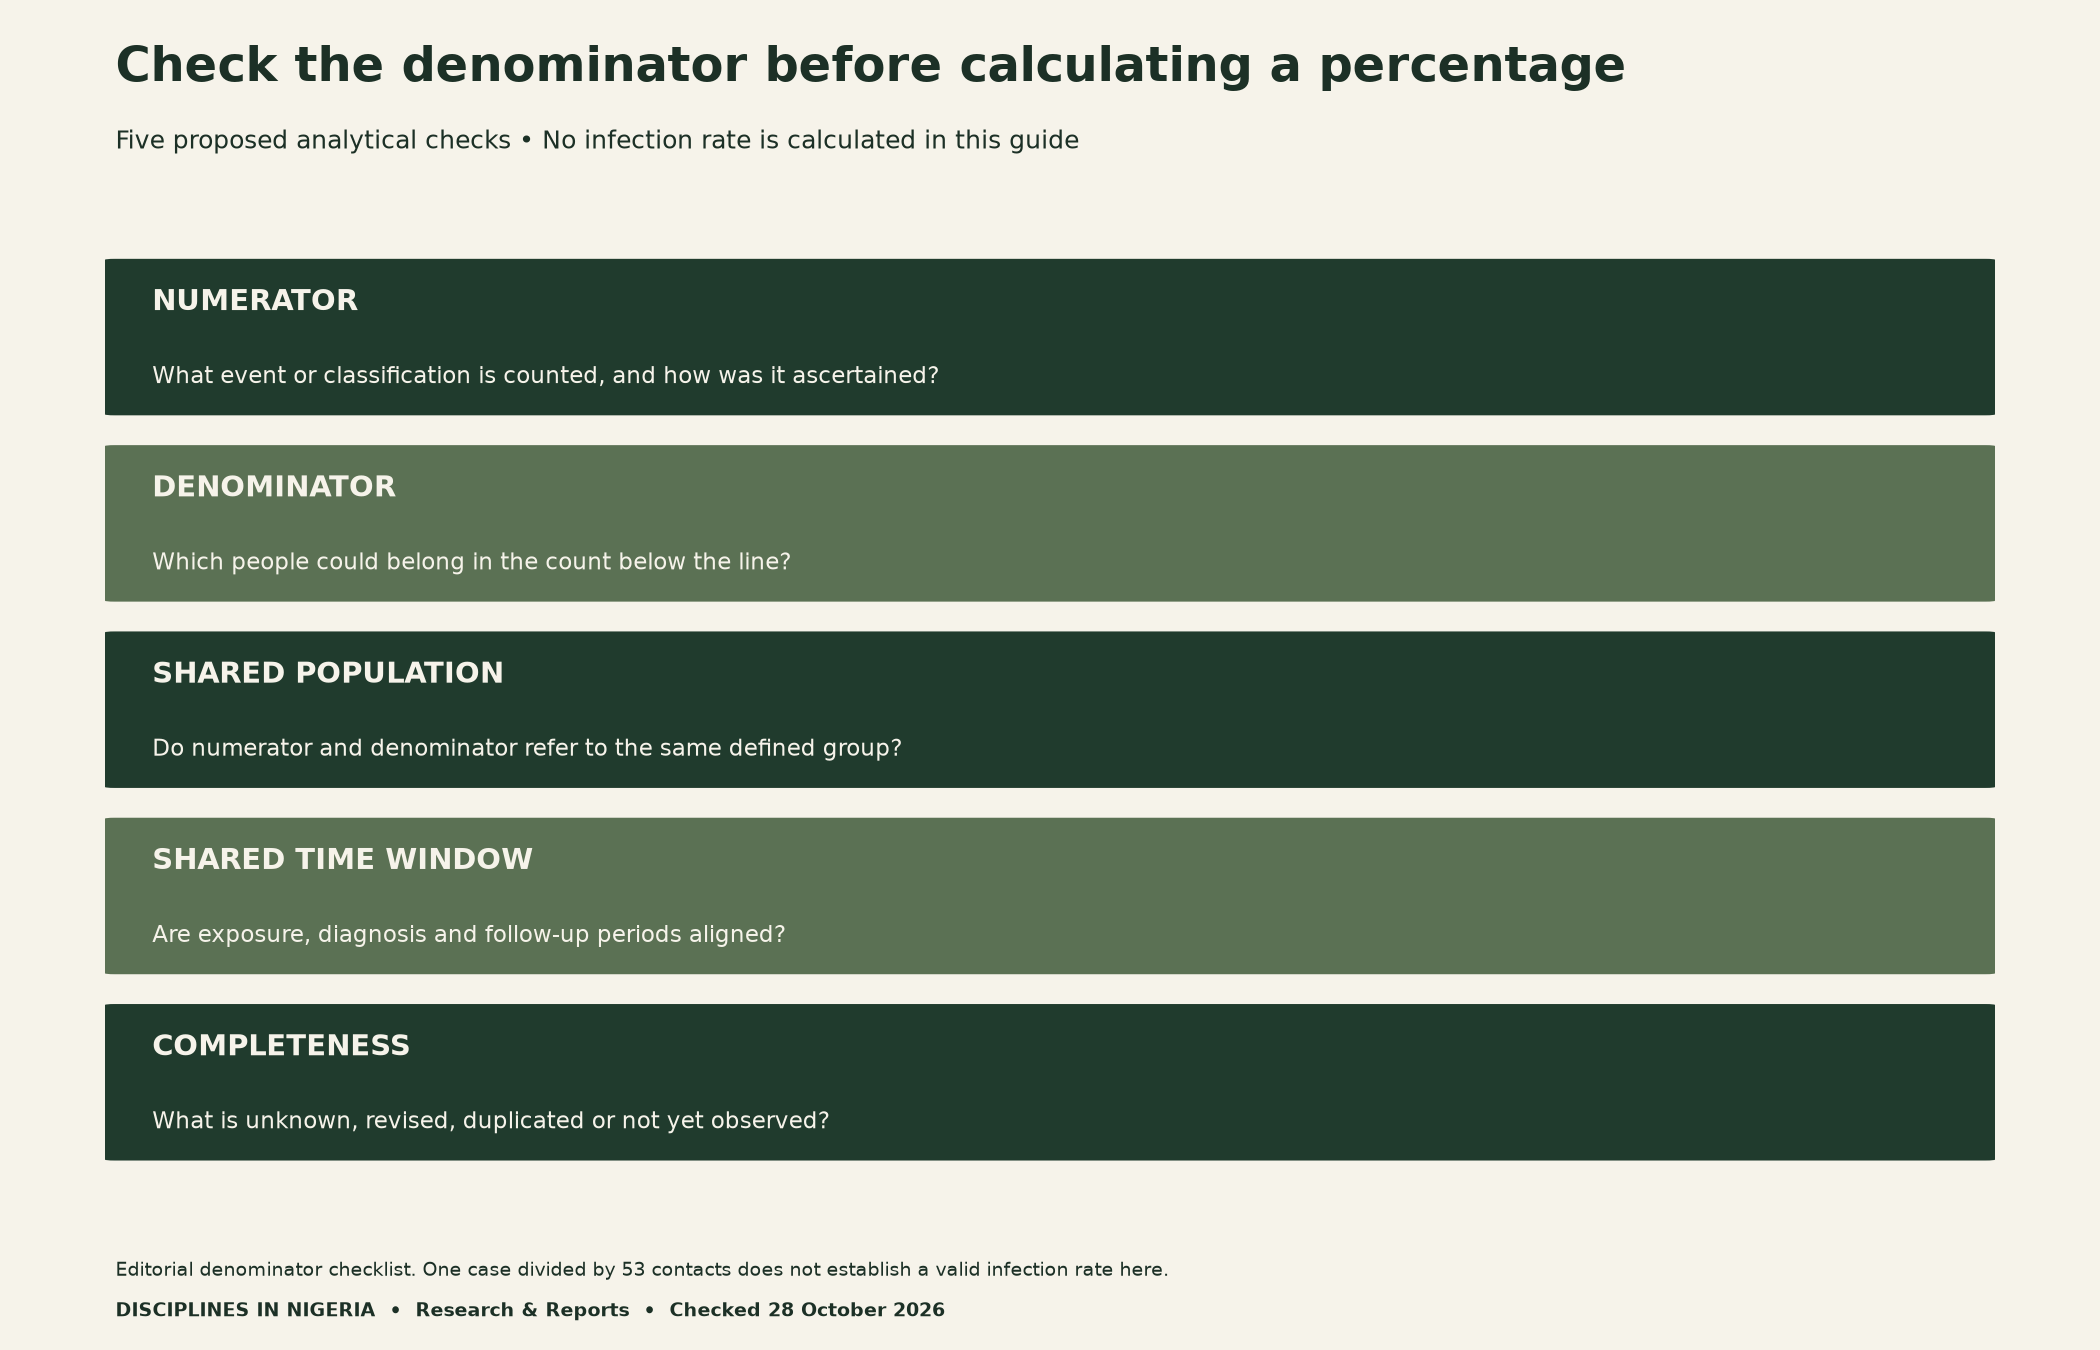
Before publishing any percentage, write its intended meaning in a complete sentence. Then check the event definition, eligible population, observation period, missingness and revisions. If those requirements are unresolved, report the counts with their dates and limitations instead. Numerical precision cannot repair a poorly defined measure.
Use the same discipline when reading international assessments. A risk statement for one geography and population does not automatically describe another. We do not transfer ECDC’s EU/EEA assessment to Nigerians, predict spread or conclude that transmission is controlled from the small dated counts shown here.
Methods, limitations and downloadable teaching tools
Our interpreting Ebola surveillance data Nigeria resource transcribes three source-ledger rows and tests only the fictional addition. We use no patient-level records, calculate no attack rate and estimate no transmission model. The public counts cannot establish unobserved infections, monitoring completion or an individual’s clinical status.
For another example of matching a claim to its evidence, read our research design and claim matrix. Our institutional research-readiness checklist also helps students identify support and permissions before collecting sensitive data. Neither resource authorises access to a surveillance line list.
Download the dated surveillance evidence ledger (CSV): three rows, source URLs, publication dates and observation labels. The two ECDC rows repeat one contact snapshot.
Get the blank seminar worksheet (CSV): eight proposed discussion prompts with empty notes fields. It is unvalidated and contains no personal health data.
Use the fictional workload example (CSV): two wholly hypothetical teaching steps. Its values must never be presented as Nigerian outbreak observations.
Source-update note: Prepared and checked on 28 October 2026 against the dated NCDC statement and ECDC updates above. We retain their original observation labels. If later evidence changes a teaching claim, add a dated revision note and retain the earlier ledger rather than silently relabelling old counts as current.
Suggested citation: Naija Scholar, Disciplines In Nigeria (28 October 2026), “Nigeria’s Ebola Surveillance Data: How Public-Health Students Should Interpret Cases, Contacts and Follow-Up.” Credit NCDC and ECDC for their reported observations; cite this guide for its editorial diagrams and proposed classroom tools.


