







NGO economic impact measurement in Nigeria becomes easier to evaluate when you separate the records, valuation choices and model assumptions behind a headline. A calculator can confirm multiplication. However, it cannot establish that the input represents the intended population or that a multiplier fits the question.
This worked case study helps public-administration, economics and development-studies students audit a published estimate. We reproduce two calculations, vary one assumption for teaching, and provide a blank evidence worksheet. The five figures distinguish reported information from our editorial methods guidance.
Research date: 28 October 2026. This is an educational analysis, not an endorsement of a model, a national nonprofit census or a new measurement of Nigeria’s GDP. Our tools have not been administered to organisations or validated as research instruments.
What the new NNNGO evidence covers
NNNGO’s report page, dated 22 October 2026, describes 4,234 member organisations. It reports an estimated annual economic footprint of ₦16.4–17.5 billion. The evidence includes an events inventory covering 2023 to mid-2026. Therefore, the publication date is not the observation period for every input.
The official release gives operating-income inputs of ₦11.7–12.5 billion and a multiplier of 1.4. It acknowledges self-reported budget bands and coverage of one network. The full report requires a contact-information form. We did not submit that form or inspect the underlying membership records.
NGO economic impact measurement in Nigeria: reconstruct the arithmetic
Keep the monetary unit fixed throughout the calculation. In this example, both inputs and outputs are annual amounts in Nigerian naira billions. The multiplier has no monetary unit. Multiplying by it changes the modelled amount; it does not change billions into trillions.
| Endpoint | Operating income, ₦bn/year | Multiplier | Calculated output, ₦bn/year |
|---|---|---|---|
| Lower | 11.7 | 1.4 | 16.38 |
| Upper | 12.5 | 1.4 | 17.50 |
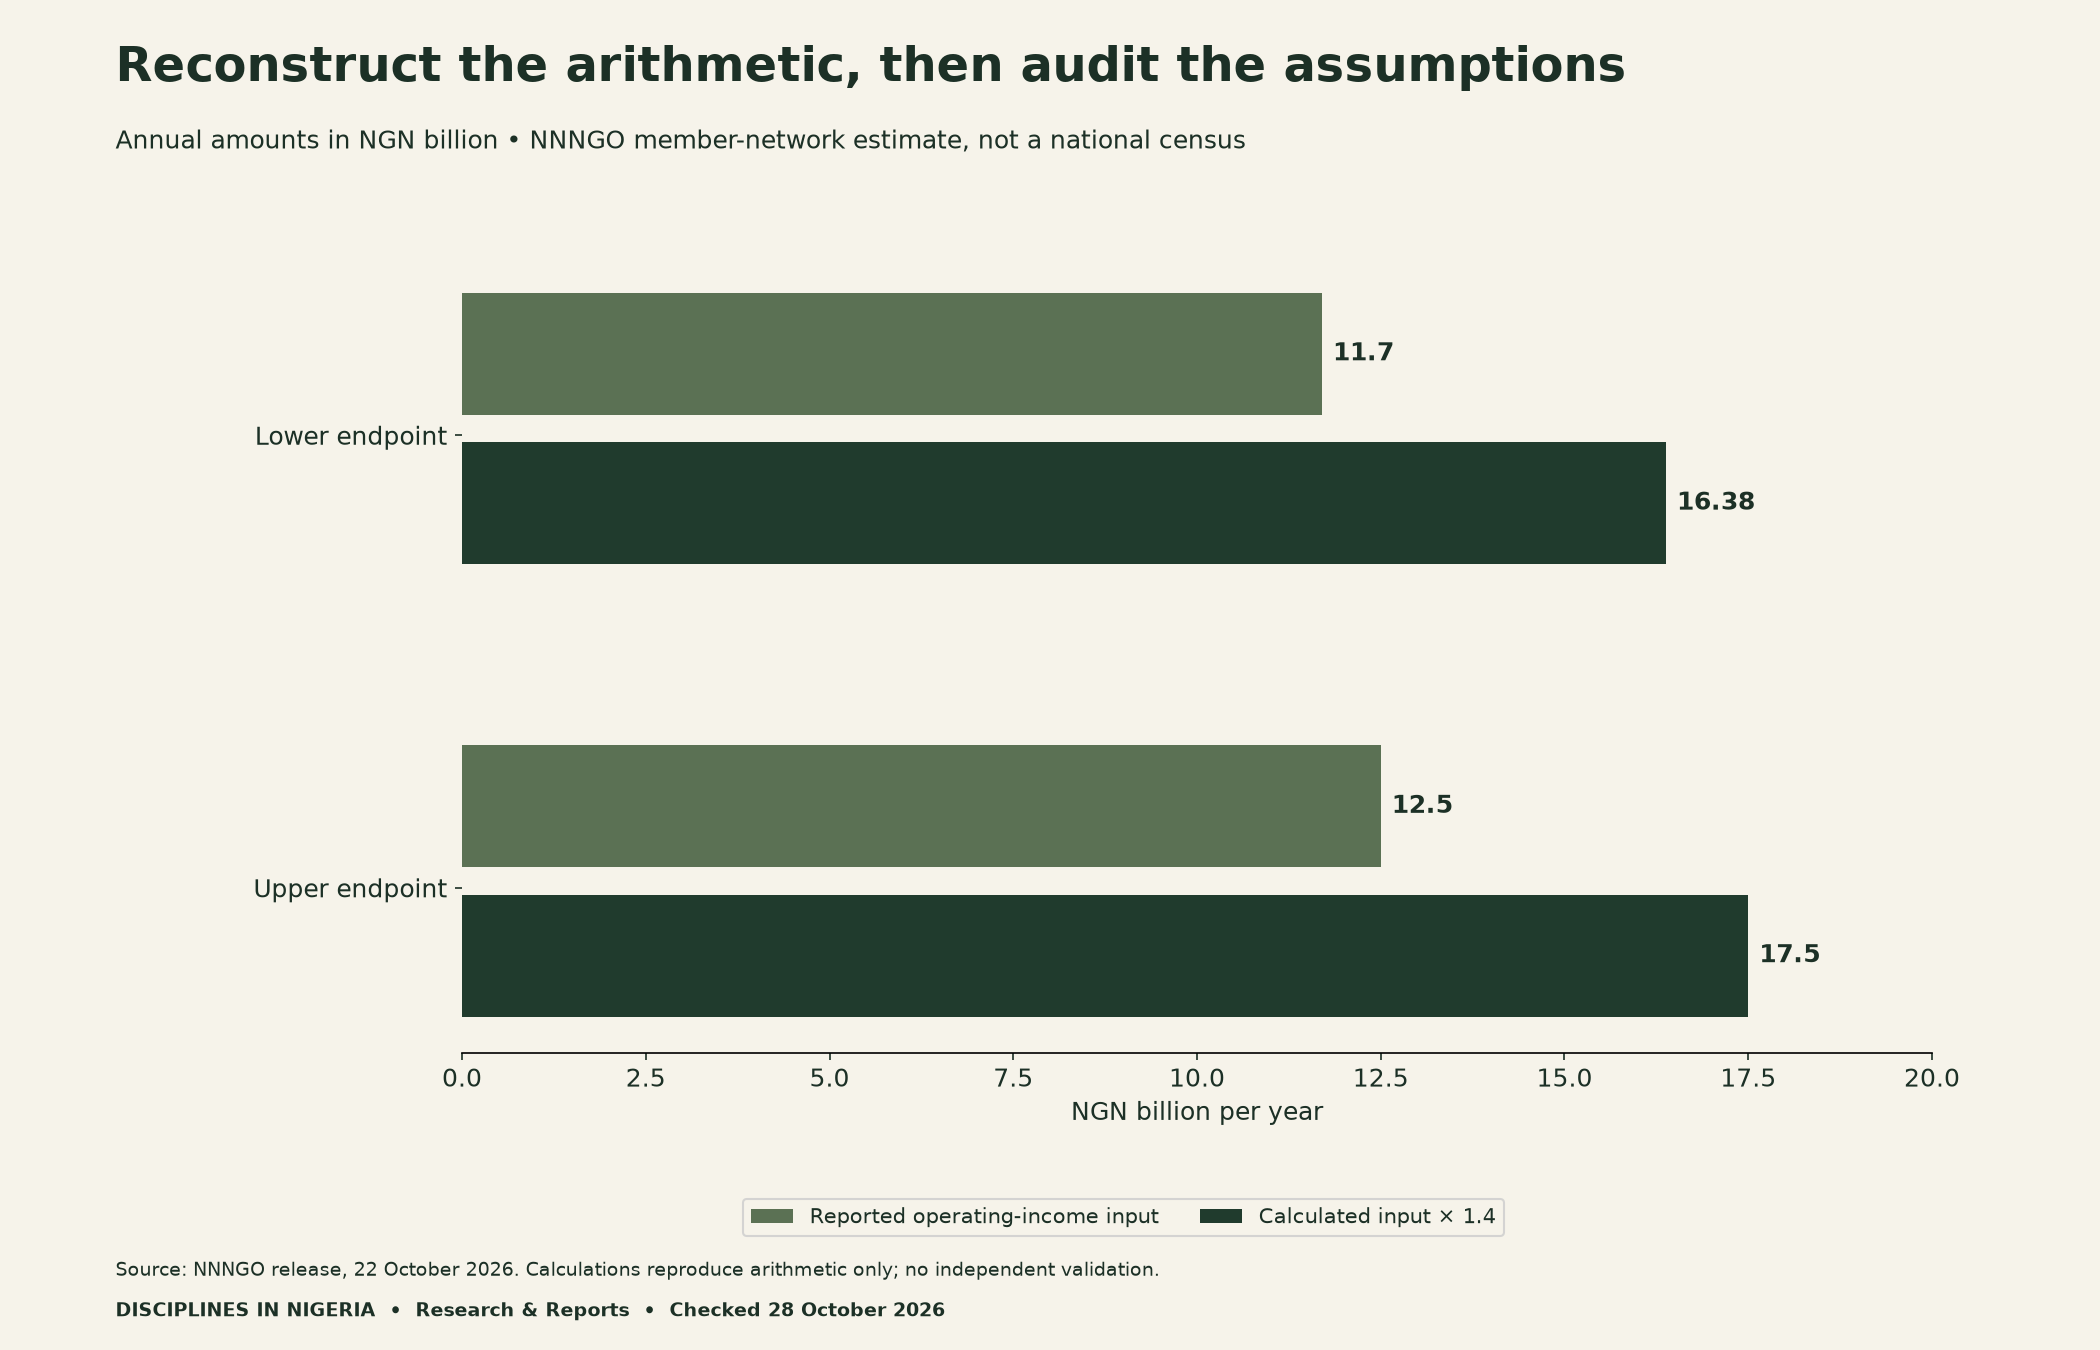
Rounding the lower result to one decimal place gives 16.4; the upper result becomes 17.5. That agrees with the headline’s displayed precision. Nevertheless, arithmetic agreement does not validate either the income estimates or the multiplier. Extra decimal places in a calculation do not create more precise source evidence.
The release also gives a broader plausible range of ₦14–22.5 billion. We retain that distinction but do not claim to reconstruct its derivation. It is not the same interval as the two calculations above. Neither interval is labelled a statistical confidence interval in this article.
Separate three evidence layers before judging the result
First, identify the source frame and records. Next, identify how recorded categories become numerical inputs. Finally, identify the model that transforms those inputs into a result. These layers need different checks, even when a single spreadsheet contains all of them.
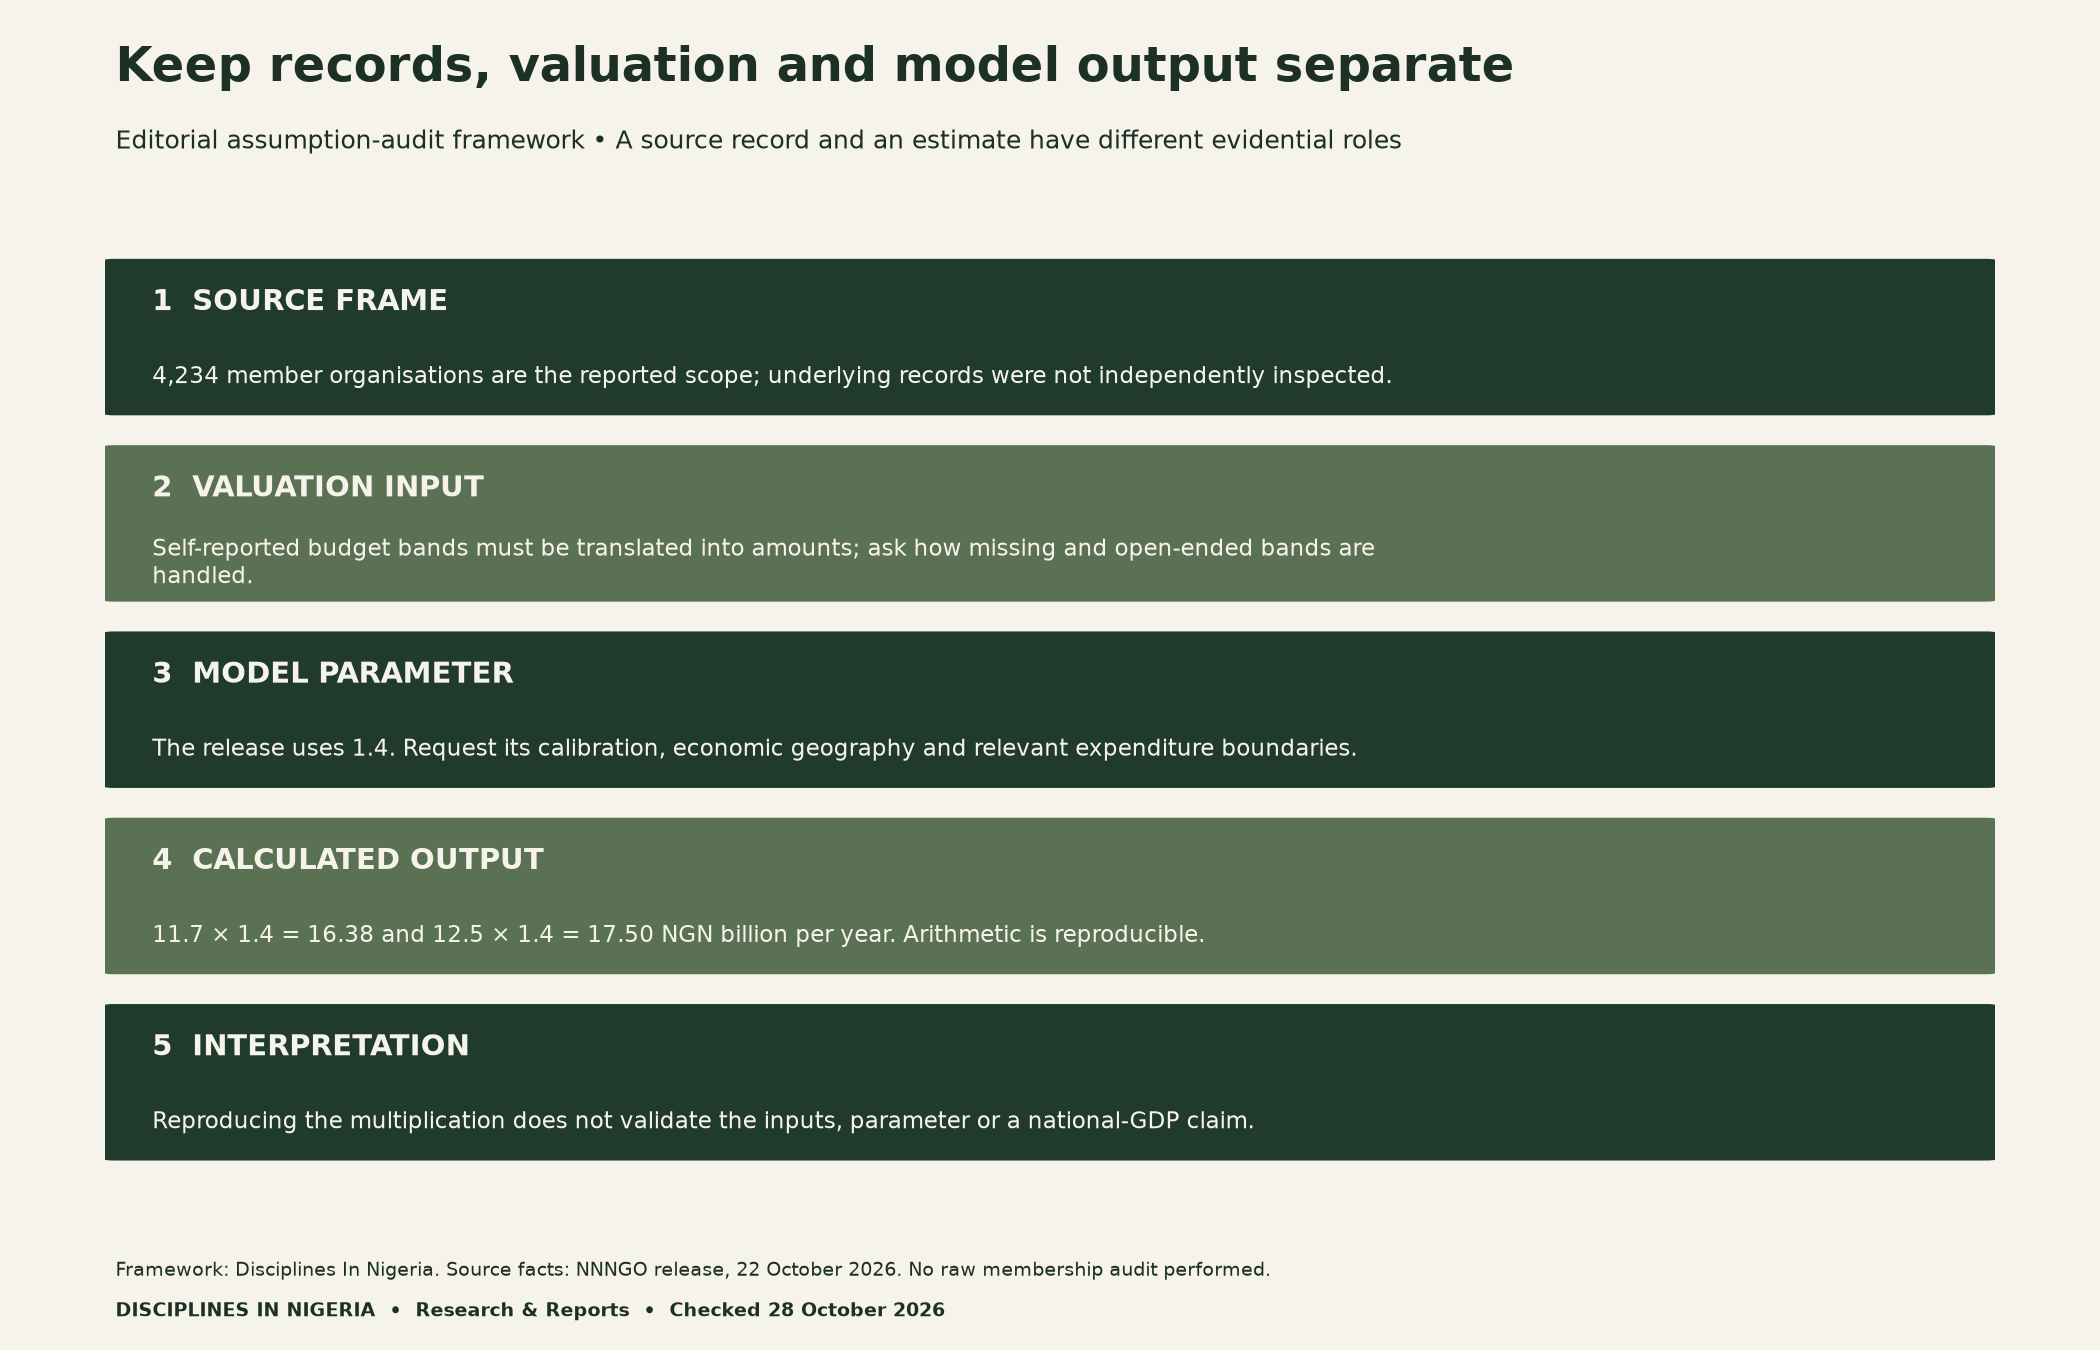
For a budget-band dataset, request the band boundaries and the amount assigned to each band. Also ask how the analyst handles missing entries and an open-ended top category. These questions identify what further evidence would be needed. They do not establish that a particular valuation choice is wrong.
Use an explicit provenance field for each number. Label a directly recorded amount as observed only when the underlying record supports that label. Describe a value assigned from a band as inferred or valued. Mark a result generated by a model as modelled. Here, we have reported inputs, rather than independently observed organisation-level accounts.
Test multiplier sensitivity without inventing new estimates
A useful classroom exercise holds the income endpoints fixed and changes only the multiplier. Our illustrative grid uses 1.0, 1.2, 1.4, 1.6 and 1.8. Only 1.4 is the assumption reported in this release. The other values are deliberately chosen teaching assumptions, not estimated Nigerian parameters.
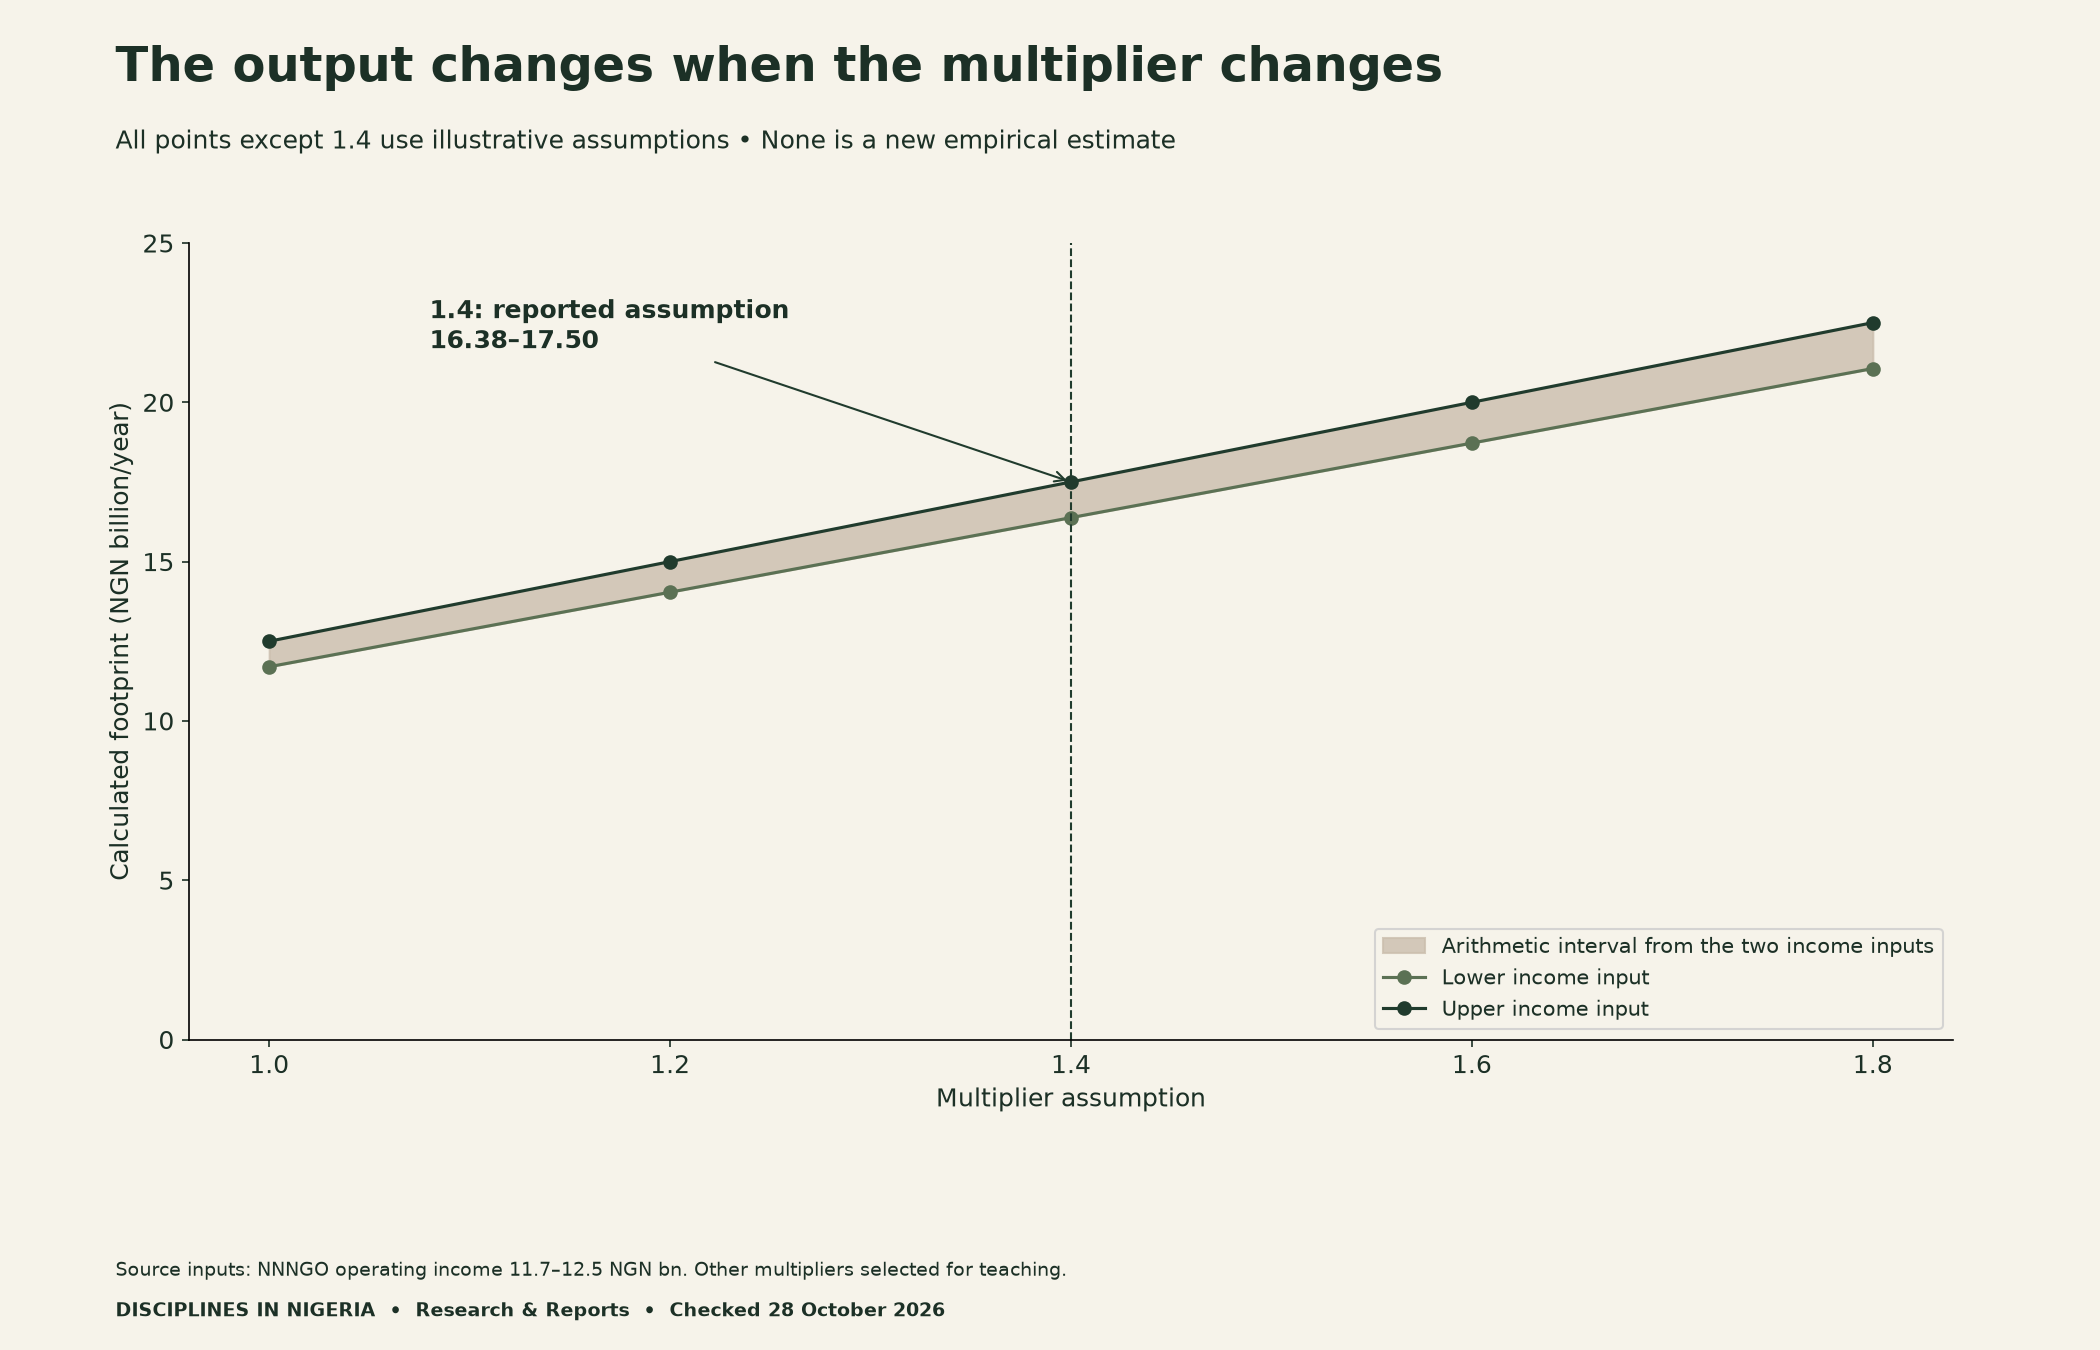
For example, 1.2 produces an interval of ₦14.04–15.00 billion. At 1.6, the result is ₦18.72–20.00 billion. These are conditional calculations: if the specified input and parameter were used, this arithmetic would follow. They do not establish that either scenario is likely.
The US Bureau of Economic Analysis guide illustrates why input-output models require explicit assumptions. It is background reading about modelling, not evidence for NNNGO’s parameter. We do not transfer a US multiplier to Nigeria or claim that NNNGO used the RIMS II system.
Coverage and time are part of NGO economic impact measurement in Nigeria
Define the target population before discussing completeness. A membership network and all active nonprofits are different frames. To estimate coverage, a researcher would need a suitable comparison register, a reference date and rules for matching duplicate or inactive organisations. We have not performed that exercise.
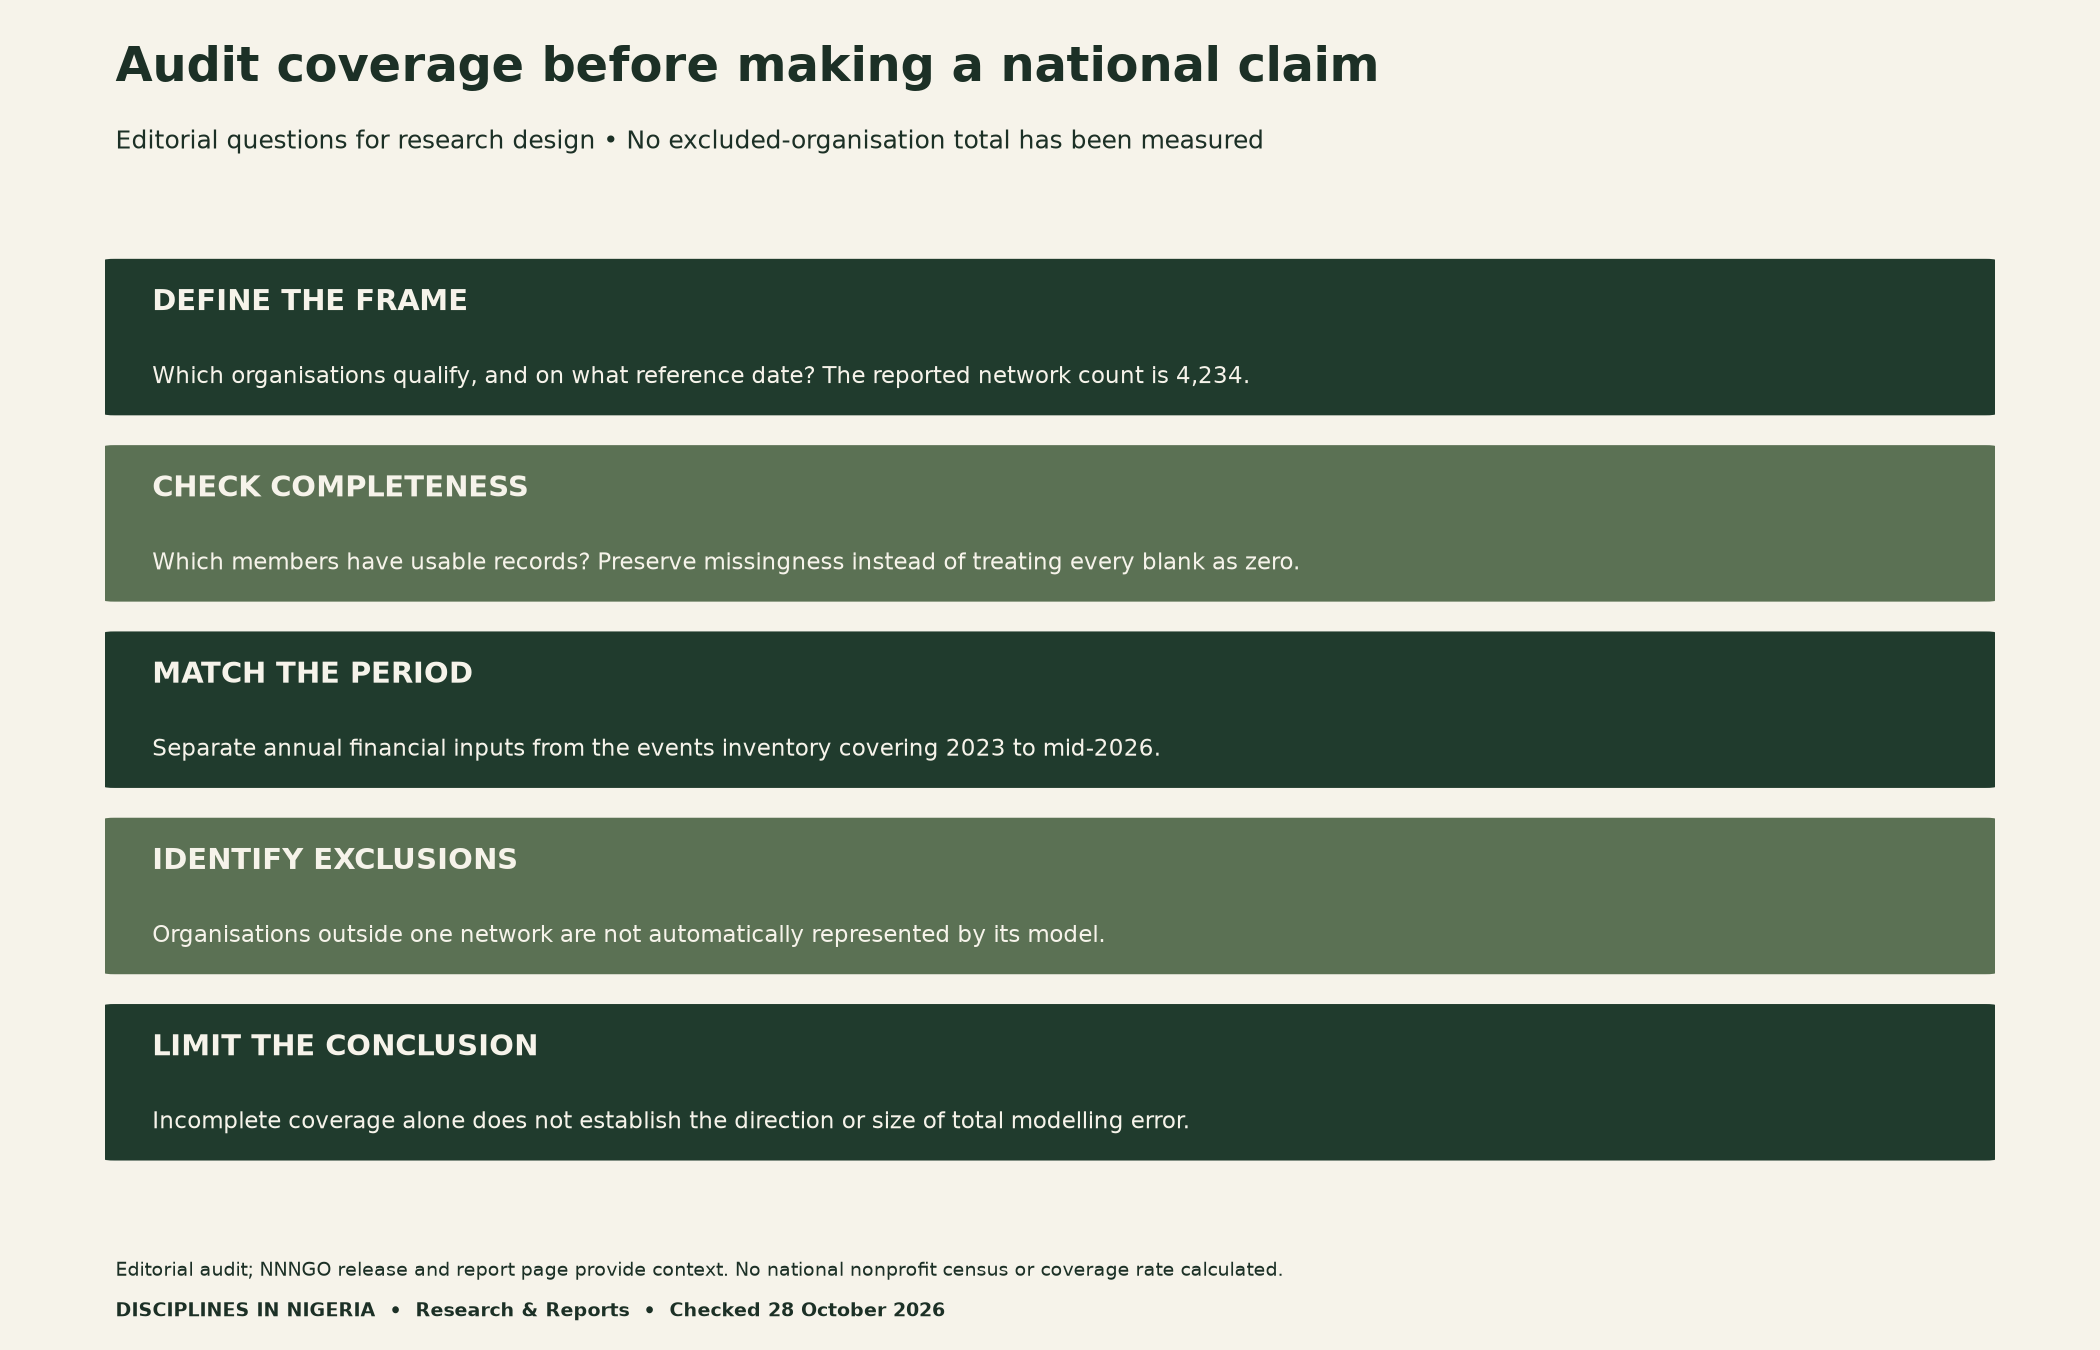
Also distinguish an annual financial measure from a collection of events across several years. Ask which records inform the annual estimate and how the analyst converts any multi-year information. Do not add historical event totals to annual income without checking the method and potential overlap.
A limited frame can omit activity. However, that fact alone cannot demonstrate that every other assumption understates the result. Reporting errors, valuation rules and model choices can operate in different directions. A careful conclusion acknowledges the missing evidence rather than assigning a universal correction factor.

Avoid switching between income, output and value added
Before comparing studies, check what each output measures. Operating income, expenditure, gross output, value added and full-time-equivalent employment are not interchangeable. A common currency symbol does not make two financial concepts comparable. Similarly, a work-equivalent measure does not automatically count unique people.
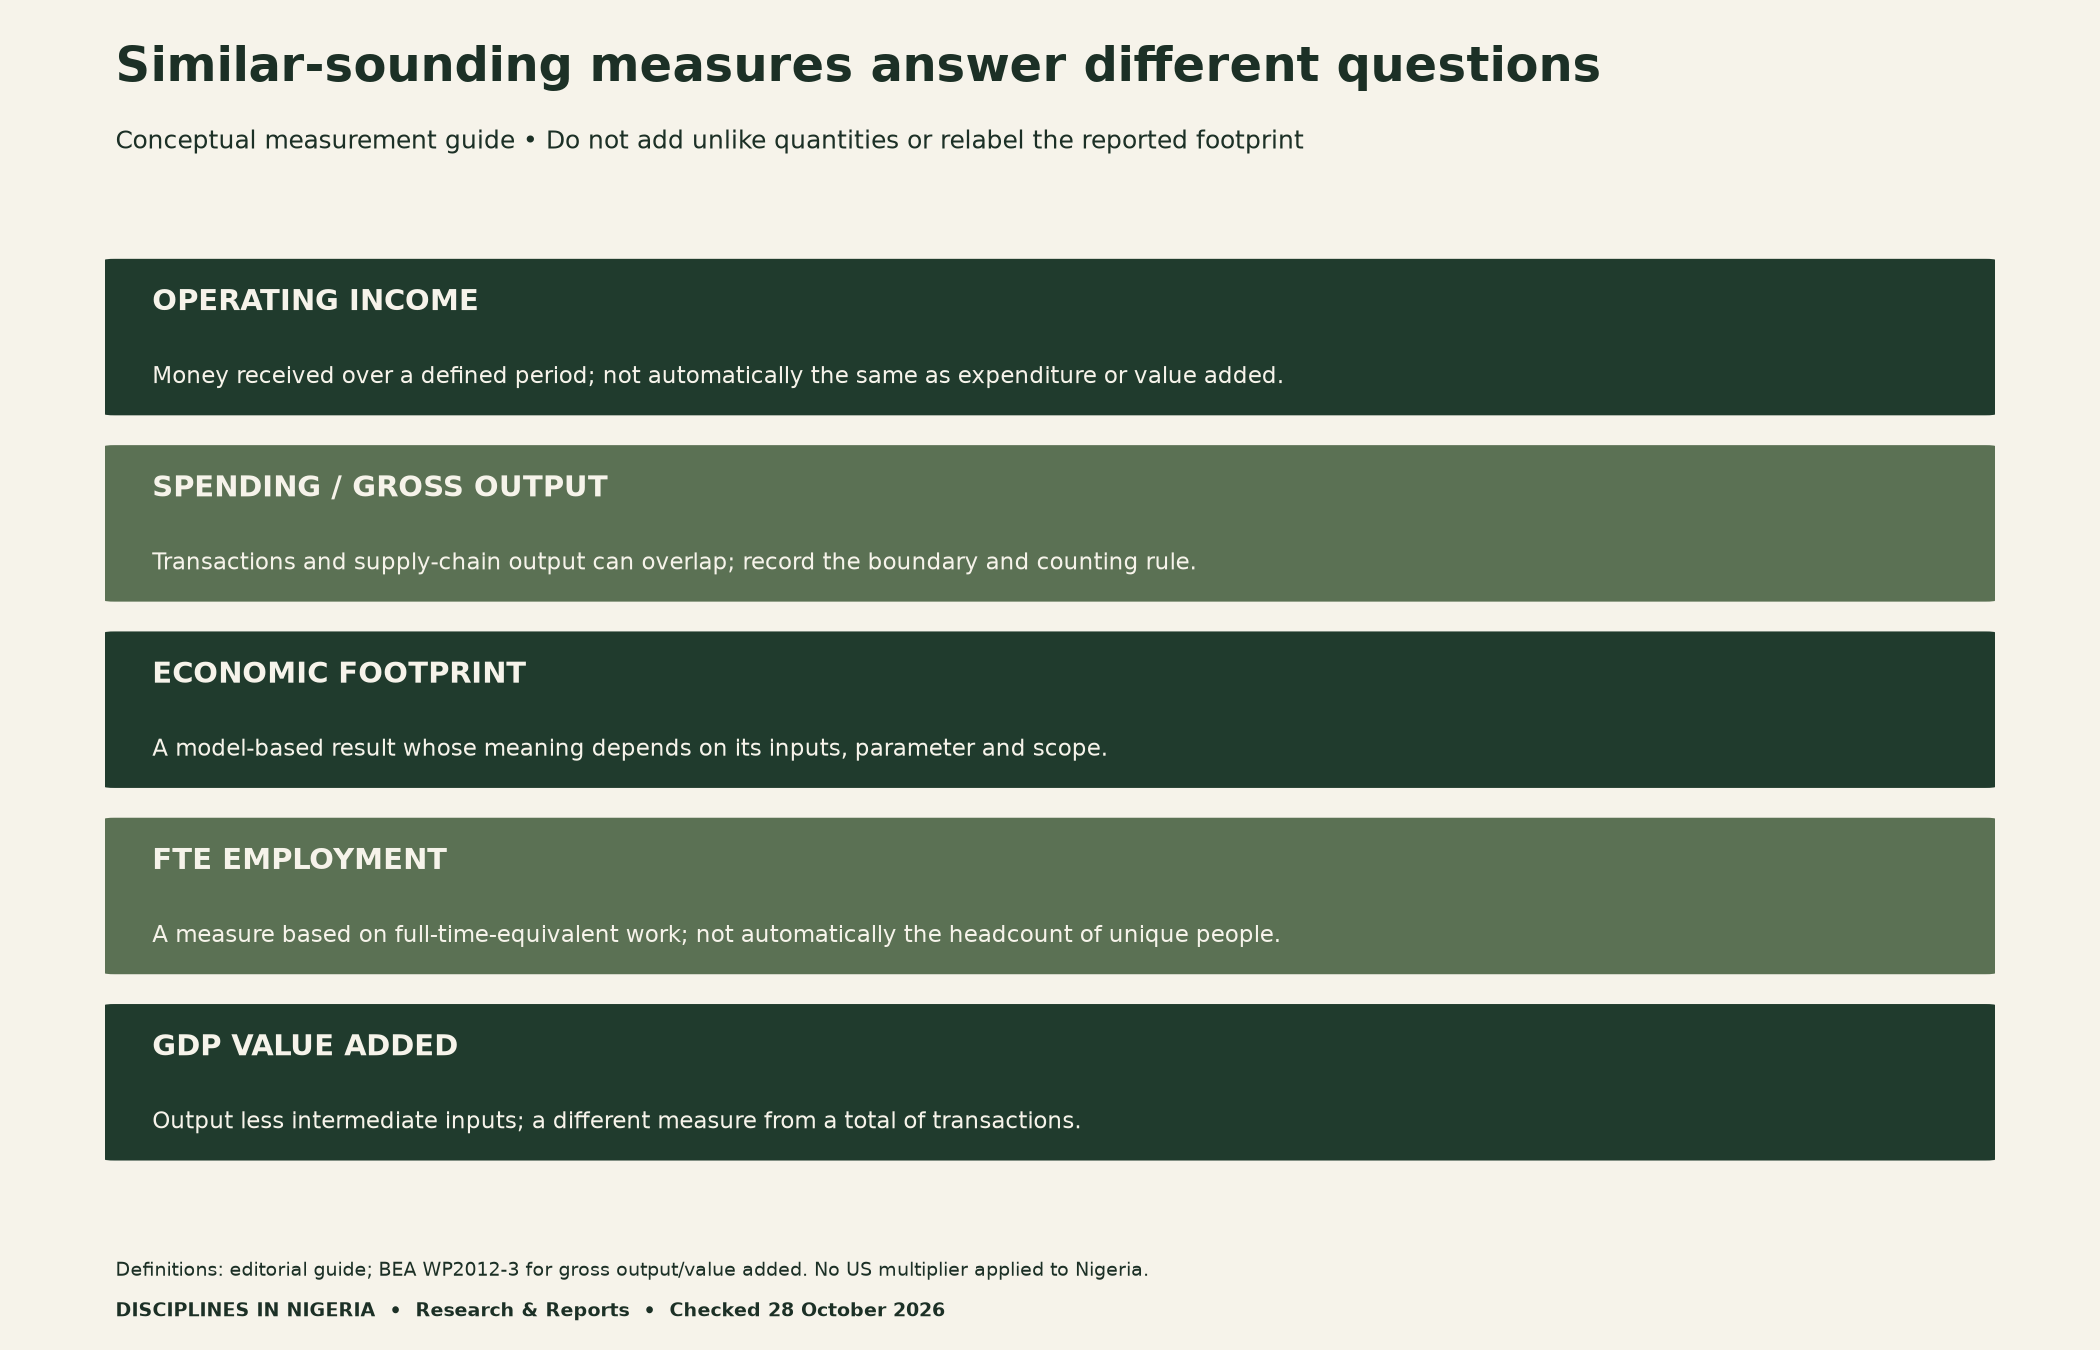
The BEA methods paper defines value added as gross output less intermediate inputs and explains the duplication within gross output. This supports a general warning about labels. It does not establish the precise accounting treatment inside a report we could not access in full.
For your own assignment, state the question before selecting the measure. Describing financial scale, estimating a supply-chain footprint and testing a programme’s effect require different evidence. Do not rename the reported footprint as tax revenue, profit or a direct addition to GDP.
Build a stronger student research protocol
Start with a short inclusion rule and a dated evidence ledger. For each input, retain its source, unit, reference period and verification status. Then document transformations in a separate calculation sheet. This makes disagreements easier to trace because source values remain distinct from your analytical choices.
Next, specify what could overlap. For example, an organisation’s payment and its supplier’s receipt can describe the same transaction. That is a hypothetical accounting example, not an allegation about NNNGO’s records. Decide how your chosen measure treats such relationships before adding amounts together.
Finally, document uncertainties and exclusions before writing a headline. Ask a reviewer to trace one input through the calculation and back to its source. Our research-readiness evidence guide offers a related way to distinguish documented support from an unverified claim. Neither checklist substitutes for research supervision or access to the relevant records.
Methods, limitations and downloadable tools
Our NGO economic impact measurement case study for Nigeria uses the accessible official release and report description. Decimal arithmetic reproduces the two 1.4-multiplier endpoints. The sensitivity file contains ten rows: two income inputs at five stated multipliers. Three figures are editorial audit diagrams, not empirical results.
We did not audit accounts, validate a multiplier, estimate national coverage or reproduce the full report. The worksheet is a proposed, unadministered teaching tool. Do not put confidential organisational or beneficiary information in a public version. Retain source limitations when reusing the chart or calculations.
Download the calculation audit (CSV): ten scenario rows with units, source links and a clear distinction between the reported multiplier and illustrative alternatives. Formula: operating-income input × multiplier = calculated footprint.
Get the blank assumption-audit worksheet (CSV): eight suggested checks with empty evidence fields and a “not verified” status. It contains no completed organisation assessments.
Suggested citation: Naija Scholar, Disciplines In Nigeria (28 October 2026), “Measuring NGO Economic Impact in Nigeria: A Worked Research-Methods Case Study.” Credit NNNGO for its reported figures and this article for the classroom calculations and editorial tools.